
My articles have generally had a certain style to them. I introduce a topic, then I go into the details of how I investigate the topic, then finally I show the conclusion.
I’m not “burying the lead” this time. The table below shows selected statistics from the 27 players who were identified as #1 Centers in 2021/2022. If you want to know why they are #1 Centers, or why guys like Logan Couture and Jack Hughes are not #1 Centers, the details of the scoring system can be found after the table.
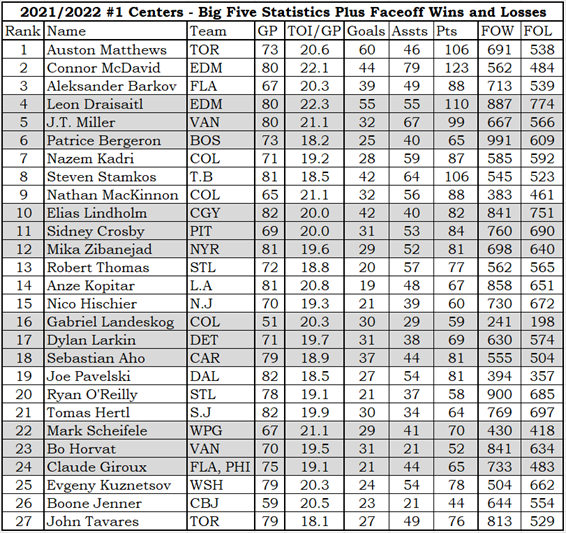
The “Big Five Statistics” are games played (GP), average time on ice (TOI/GP), Goals, Assists and Points. Faceoff wins (FOW) and losses (FOL) are also shown.
Identifying Centers
We hold these truths to be self-evident: that all centers are not created equal; that they are endowed with certain undeniable talents; that among these talents are taking faceoffs, playing defense and being good with the puck. All those characteristics, and several others, can be measured by statistics.
There are aspects of players that cannot be measured, so they won’t be included as criteria in rating centers. Is the guy a good leader? I don’t know how the numbers show that. Is the guy a cancer in the locker room? I don’t know how the numbers show that. Does the guy look like a center? To quote Adam Smith, an 18th-century economist: this ain’t no beauty contest.
Rating formulas are immune to how a player looks and do not consider what the press clippings are. I would hope that the Center Rating (CR) method will produce results that agree with well-respected hockey websites, but I also expect there to be some differences. I hope that the CR method’s results will be easy to defend.
Quality vs. Quantity
The first issue to decide in designing this rating formula is whether it should be based on quality or quantity. For instance, should the formula use the number of faceoffs taken throughout the season (a quantity statistic) or the number of faceoffs taken per game played (a qualitative, or descriptive, statistic)?
I decided that Center Rating is a qualitative issue. This will prevent a good center from being under-rated because he missed some games and will also prevent a mediocre center from being over-rated because he played every game.
Since quality statistics are going to be used, it is necessary to ensure that they are not based on a trivial number of games or a trivial number of faceoffs. Part-time players should not be included.
Culling the Herd: Centers Take Faceoffs and Centers Play Games
STTB uses data from naturalstattrick.com to create one record for each player for each season since the 2007/2008 season. There are a total of 13,390 records Obviously, there are defensemen and wingers in that group.
To qualify for consideration as a center, a player must have taken the faceoff on his shift starts at least 20% of the time. If a player has 600 shift starts and took 108 faceoffs (18% of the faceoffs available), he’s a winger, not a center. The 20% rule brings the number of records down to 3,572.
All defensemen were eliminated, and many players who are listed as centers were also eliminated. In 2021/2022, Jonathan Dahlen was a center who played 60 games in San Jose. He lost the only faceoff he took (he took one more faceoff than I did): he is not a center. Pierre-Luc Dubois, a registered Left Winger, took 1,112 faceoffs: he is a center.
The data set contains records for players who only played a handful of games in a season. It says here you cannot be a number one center in the NHL if you are not playing lots of games in the NHL. The records of players who played fewer than 20 games were eliminated, which brings us to 2,839 records. 20 games in a season is a lot? I was feeling generous.
Now it is time to categorize the centers. What are the traits of a number one center?
Categorizing Centers
Centers will be ranked and rated based on a single calculated statistic. The numeric statistic is called CR-Score, which will be used to place a player into a CR-Category.
It was handy to bounce ideas of my son while I was going through the process of establishing the criteria for identifying the top-tier centers. I’d say, “X, Y and Z” are in the top ten, and he’d say, “You’re over-valuing defense.” I’d say, “Bobby Clobber isn’t in the top ten because he doesn’t take a ton of faceoffs” and he’d say, “Modern hockey has more faceoff specialization than it did back when you were cheering for Howie Morenz.” That comment cost him 1% of his eventual inheritance.
In general: a criterion of center-play was identified; the data related to the criterion was identified; the weight of the criterion was determined (it could be a 10-point criterion or a 20-point criterion, for instance); a formula was used to convert the player’s statistic(s) in the criterion to a number of points. The CR-Score was calculated by adding all of his criteria scores together. Finally, the CR-Score was converted into one of four categories: #1-Center, #2-Center, #3-Center, #4-Center.
Faceoffs
There are two faceoff related criteria for categorizing centers: frequency of taking faceoffs, and frequency of winning faceoffs. Both are 20-point categories.
The datum for the frequency of taking faceoffs is “Faceoff percentage of shifts” (FO%S). A player who started 25 shifts in a game and took 15 faceoffs has a FO%S of 60%.
For the frequency of winning faceoffs, I’ll use faceoffs won per game rather than faceoff winning percentage. Using faceoff winning percentage would infer that a player who won 200 of 400 faceoffs was as valuable as a player who won 600 of 1,200 faceoffs, which is incorrect. The former player won about 2.5 faceoffs per game, while the latter won 7.5 faceoffs per game.
Time On Ice
Top tier centers play a lot. The are two time-related criteria, average time on ice per game and average penalty kill time on ice per game.
Time on ice is a 25-point category, and Penalty-Kill time on ice is a 10-point category.
Scoring
Top tier centers score. They score goals and they get assists. Scoring is a 150-point category and is based on points scored per game played.
Puck Management
A center is “good with the puck”. With the statistics that are available, the “good with the puck” statistic is the sum of blocked shots and takeaways minus the number of giveaways. It is a 35-point category.
Shot Management
A top center creates shots for his team and stifles shots by the other team. This is nicely measured in the stats by Corsi, and I will use team-relative Corsi. A good center will have a better personal Corsi than his team’s Corsi, as his team is worse-off when he’s not on the ice.
This is a 40-point category.
Defensive Reliability
A top center knows the name of his team’s goalie. He has shift-starts in the defensive zone. This will be a 20-point category is based on defensive zone starts per game.
Productivity Rating
A top center is a top player, and top players can be identified by PR-Score. The PR-Score calculation uses all of the center stats plus a few more, but uses them with different weights. This will be a 30-point category.
Use the Center-Score to Determine the Center-Rating
The sum of all the points from the various criteria/categories produces a player’s CR-Score. The maximum possible CR-Score in the Center Rating system is 350, but that is a total that hasn’t been approached. The maximum CR-Score recorded so far is 302 (Connor McDavid, EDM, 2020/2021).
A CR-Score above 200 puts a player in the #1-Center CR-Category. 170 to 199 CR-Points puts a player in the #2-Center category. 140 to 169 CR-Points makes a player a #3-Center, and below 140 makes you a #4-Center.
You Aren’t Rating Defense High Enough
My original formula rated defensive aspects of the game much higher than the current formula does. That led to my son telling me I was overvaluing defense, and since I (over)value his input, I changed the formula to lessen the impact of defensive data.
My son also said if the list doesn’t have the 3Ms in the top ten, it is a load of crap. The 3Ms are Matthews, McDavid and MacKinnon: they are 1st, 2nd and 8th. MacKinnon missed 17 games and would have rated higher if he had played more (because his PR-Score would have been higher). He might have gotten as high as sixth place.
Summary
The opinions of people who are deeply involved in hockey carry a lot of weight, but I’m pretty certain they don’t base their opinions purely on statistics. A well-respected hockey website opined that Nazem Kadri was the second-best center in the league early in the 2021 season: surely, then, he must at least be one of the best centers in the league. Mustn’t he? Based on the Center Rating Method, he actually was one of the best centers in the league: I have him 7th best.
On comparing the CR results with two lists from well-respected websites (nhl.com, thehockeywriters.com), I think it is safe to say that CR does a damn fine job. Where there is a conflict between CR and the websites, I think CR does the better job at identifying centers.
Colorado, the Stanley Cup champions, had THREE #1-Centers: Nazem Kadri, Nathan MacKinnon and Gabriel Landeskog. Tampa Bay only had one #1-Center in Steven Stamkos.
Having a #1-Center does not make a team a winning team. For the 2021-22 season, New Jersey, Detroit, San Jose, Vancouver and Columbus all had one #1-Center, and played a total of zero playoff games.
The Center Rating (CR) method does a good job of categorizing centers. CR will be used in at least two future articles: one that identifies the best centers since 2007/2008, and another that determines the value of a #1-Center in terms of standing points. Is a #1-Center worth ten extra wins (20 points) a year? Hell no: no one player is worth ten extra wins a year. Does a #1-Center provide no extra wins a year? While I haven’t done the analysis yet, I sure hope not: a #1-Center should provide a team with a little something extra in the wins column!
2021/22 Center Rating Statistics Listing
Please refer to 2021/22 Center Rating Statistics List for a complete list!