
This is a lengthy article in terms of pages, but it is just a bunch of lists of teams’ records in various situations:
- Home and Away
- When Scoring 2 or 3 Goals
- 1-Goal and 2-Goal Games
- Defensive Battles and Offensive Battles
- Playoff Teams and Non-Playoff Teams
- Corsi Difference of 18 or More
- Shot Difference of 12 or More
- Team Defensive Effort
- Team Offensive Effort
- Goalie Play
- Faceoffs and Blocked Shots
- Hits
The league total for each situation is in bold in each list; it provides a little context to the team entries. As a bonus for the reader, there is very little commentary.
Home and Away
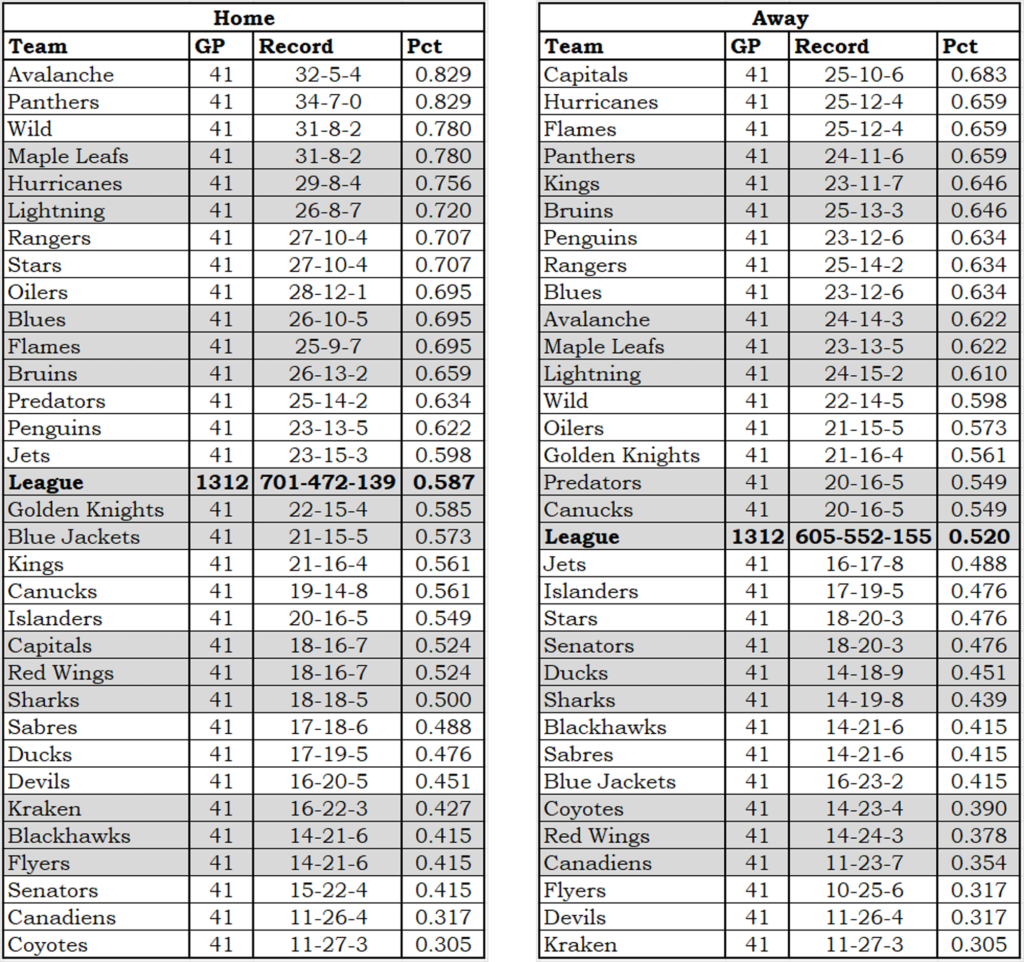
Only a few teams had a better record away from home. The Flyers were bad both at home and on the road, and their GM couldn’t figure out where else they could play.
When Scoring 2 or 3 Goals
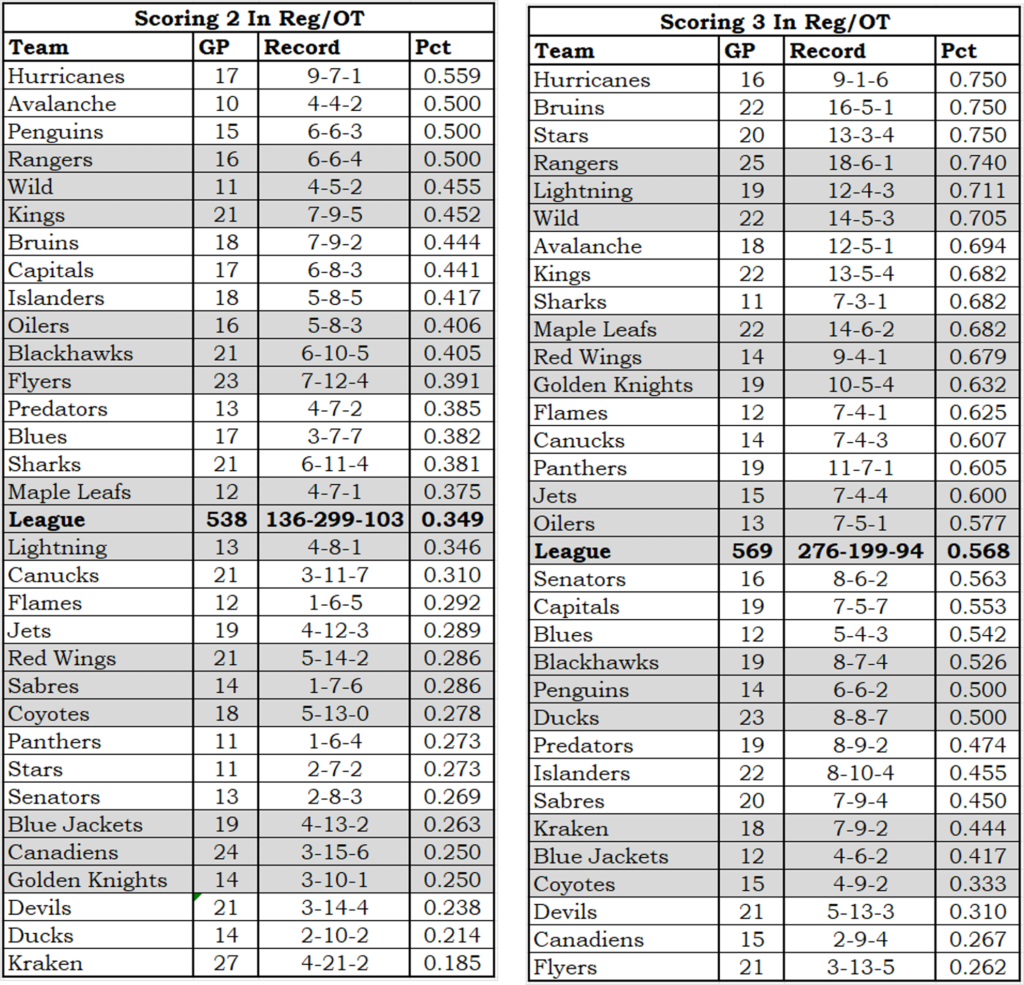
The league average for goals scored in a game is about 3 (3.106, to three decimal places). Scoring only two or three goals means a team has a chance to win.
The league-level results show how valuable a third goal can be. A points percentage of .349 is equivalent to 57 points on the season, which would put you in 31st or 32nd place in the standings.
The three-goal points percentage of .568 converts to 93 points, which would be 17th place: just outside the playoffs. The Canucks scored 246 goals in regulation and overtime last season, averaging exactly 3.000 goals per game. It got them 92 standing points.
1-Goal and 2-Goal Games
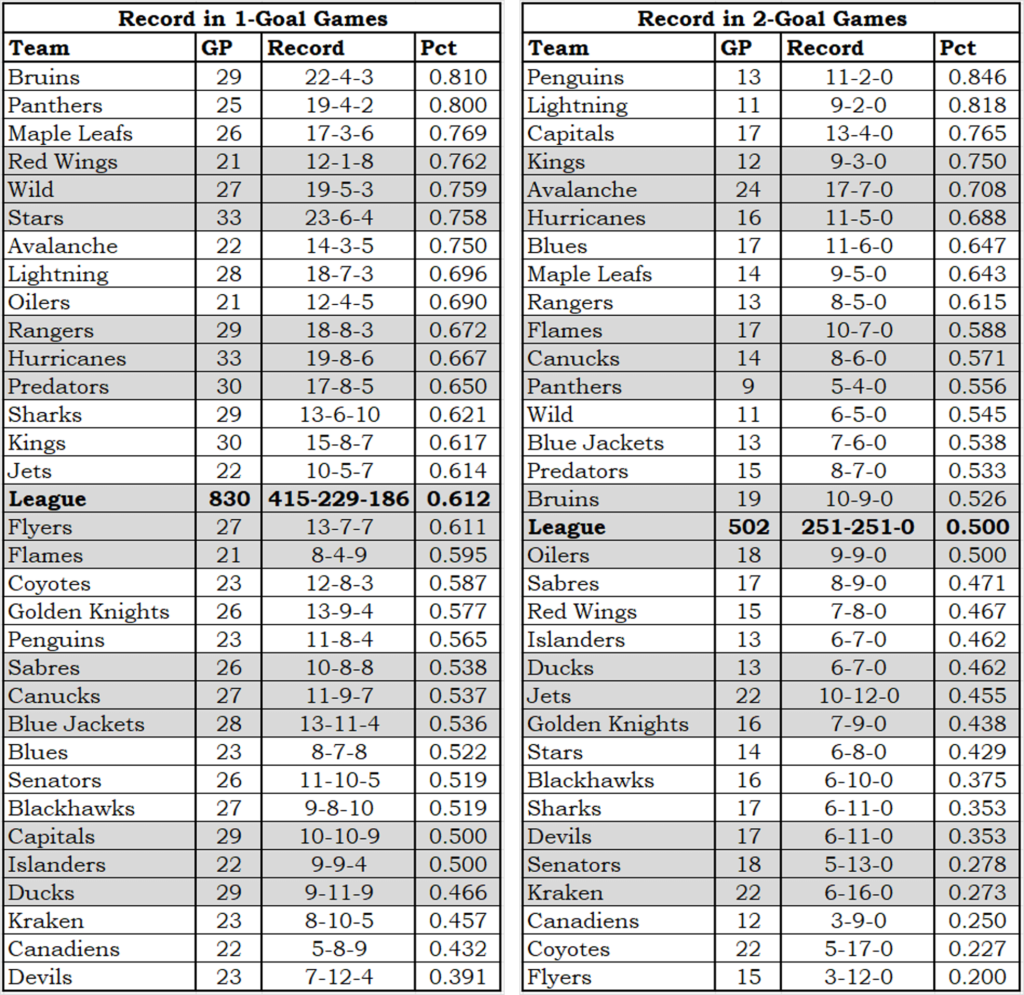
While it is true that good teams win close games it is truer that good teams win by big margins, and more truer that bad teams don’t win games by big margins.
Playoff teams got 66% of the possible points in their 1-goal and 2-goal games, compared to 48% for the non-playoff teams. The non-playoff teams did alright in their 1-goal games (54% of possible points) but did poorly in 2-goal games (38%).
Defensive Battles and Offensive Battles
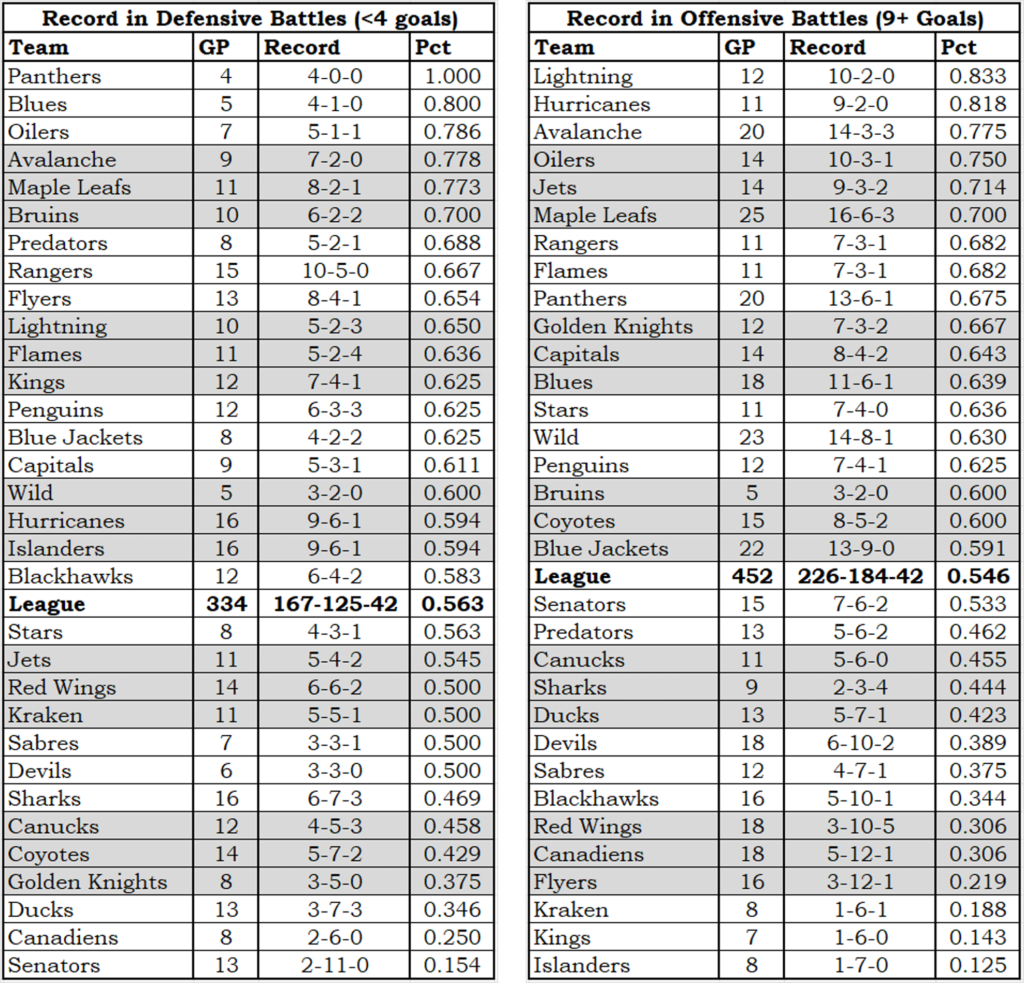
A low-scoring game had a final score of 3-0, 2-1, 2-0 or 1-0; a high-scoring game had final scores like 6-3 or 7-4 or 8-4 or 10-2.
The Canadiens didn’t like low scoring games, and they also didn’t like high scoring games. Surprisingly they won a 10-2 game, beating what was essentially the Florida Panthers AHL farm team.
Playoff Teams and Non-Playoff Teams
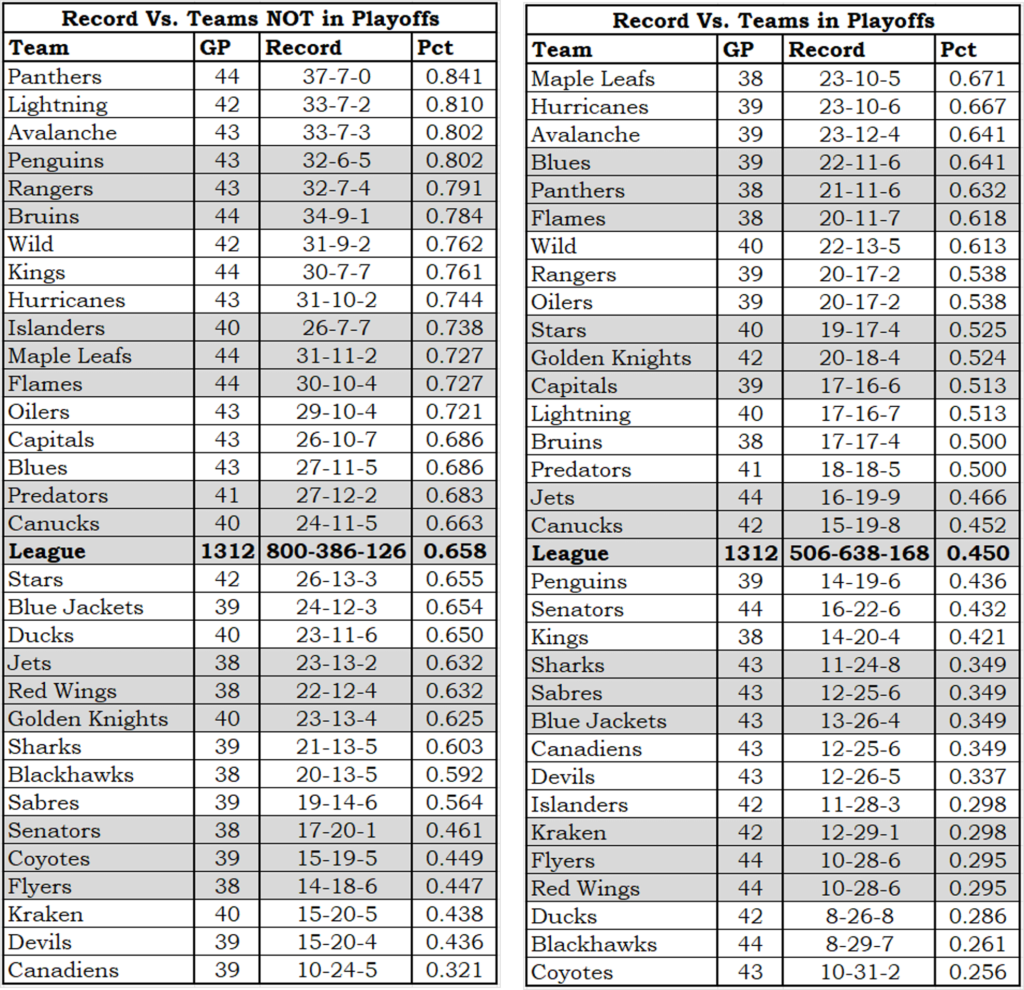
The Leafs and the Blues did not do as well against non-playoff teams as they should have, given how well they did against playoff teams. Or was it that the Leafs and the Blues did quite well against playoff teams given how well they played against non-playoff teams?
Corsi Difference of 18 or More
Corsi is a shot-attempt differential statistic, counting shots, blocked shots and missed shots.
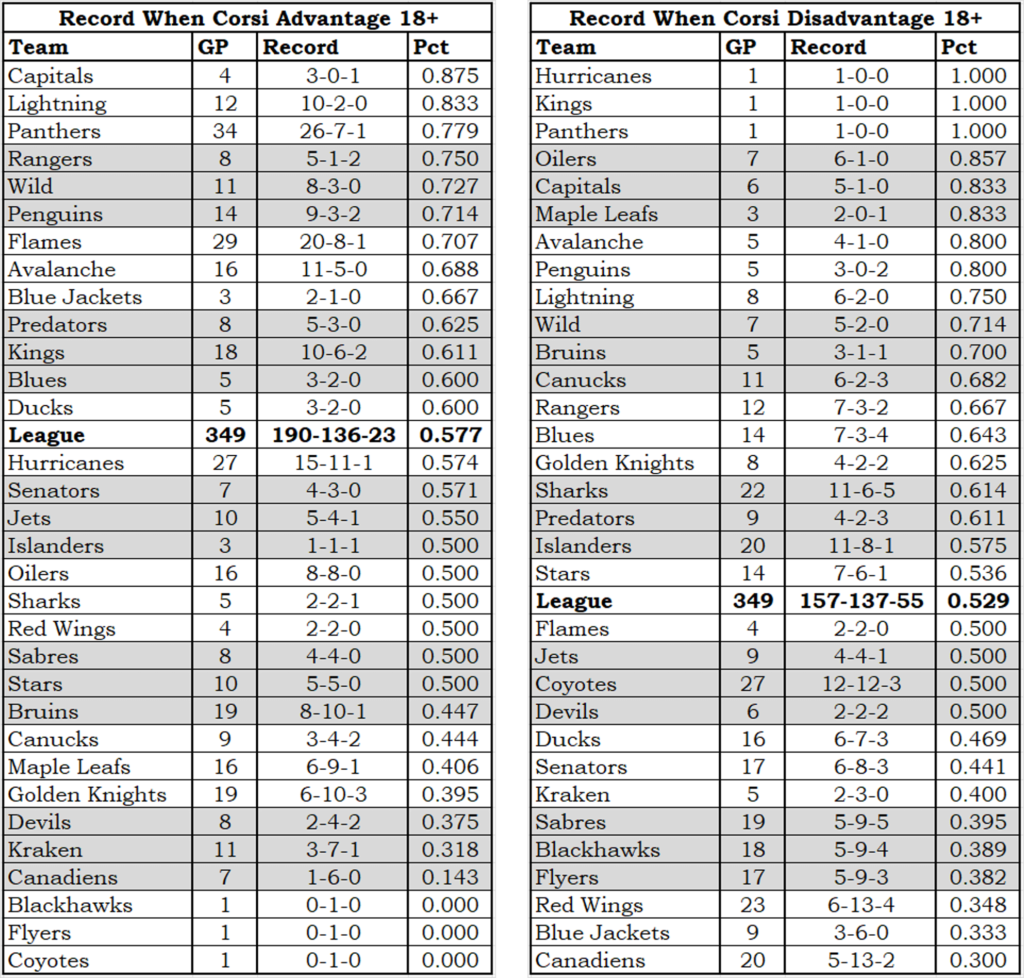
There is a big difference in games played by teams. The average playoff team averaged having a big Corsi advantage 15 times, compared to 6 for a non-playoff team. Playoff teams had a .640 points percentage when the had the big Corsi advantage, while non-playoff teams had a .426 points percentage.
Shot Difference of 12 or More
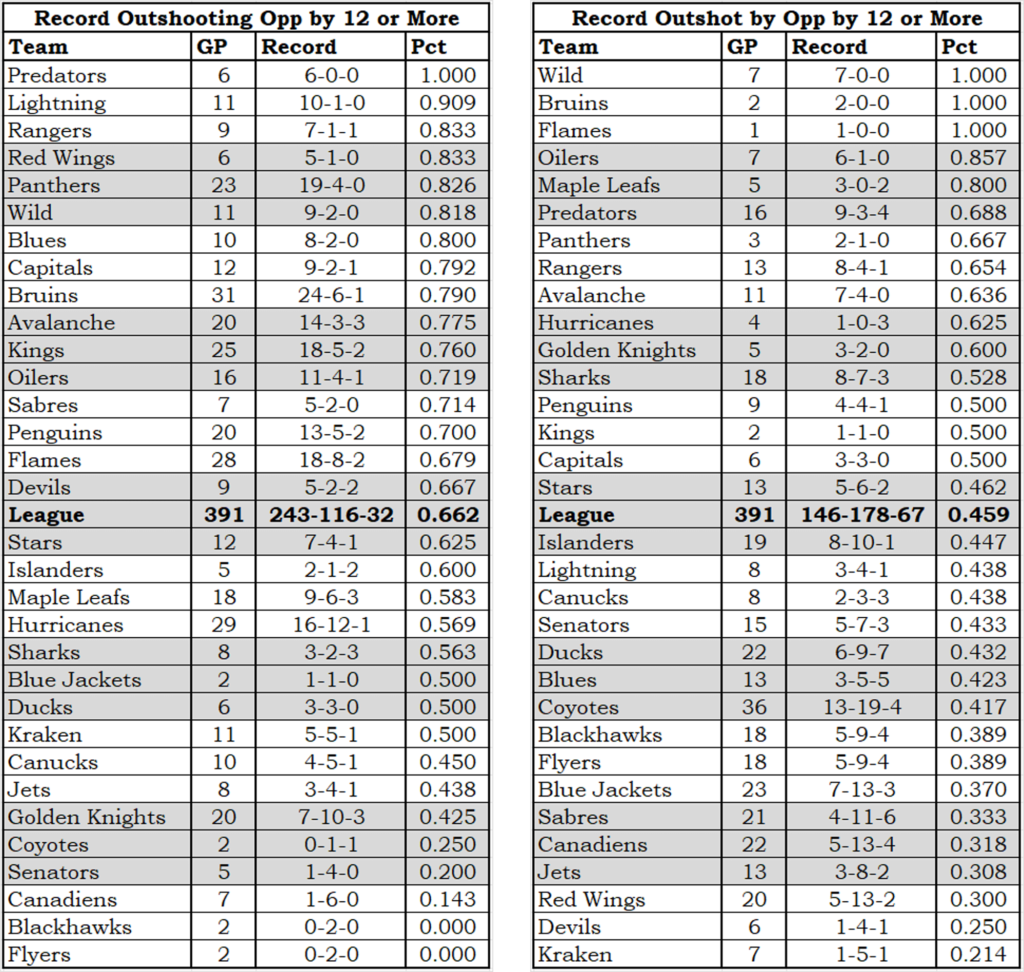
I was surprised to see that a difference in actual shots was more significant than a difference in Corsi: I had expected the results would be close. I now realize that a successful shot has more impact than a shot attempt.
Productivity Rating (PR) uses Corsi and does not use shots. Am I going to change it because of these results? No. Rewarding players for successful shots taken would just make the higher ranked players more highly ranked. Team-relative Corsi, which is used for PR, is a better measure of a player’s impact on his team’s play.
Team Defensive Effort
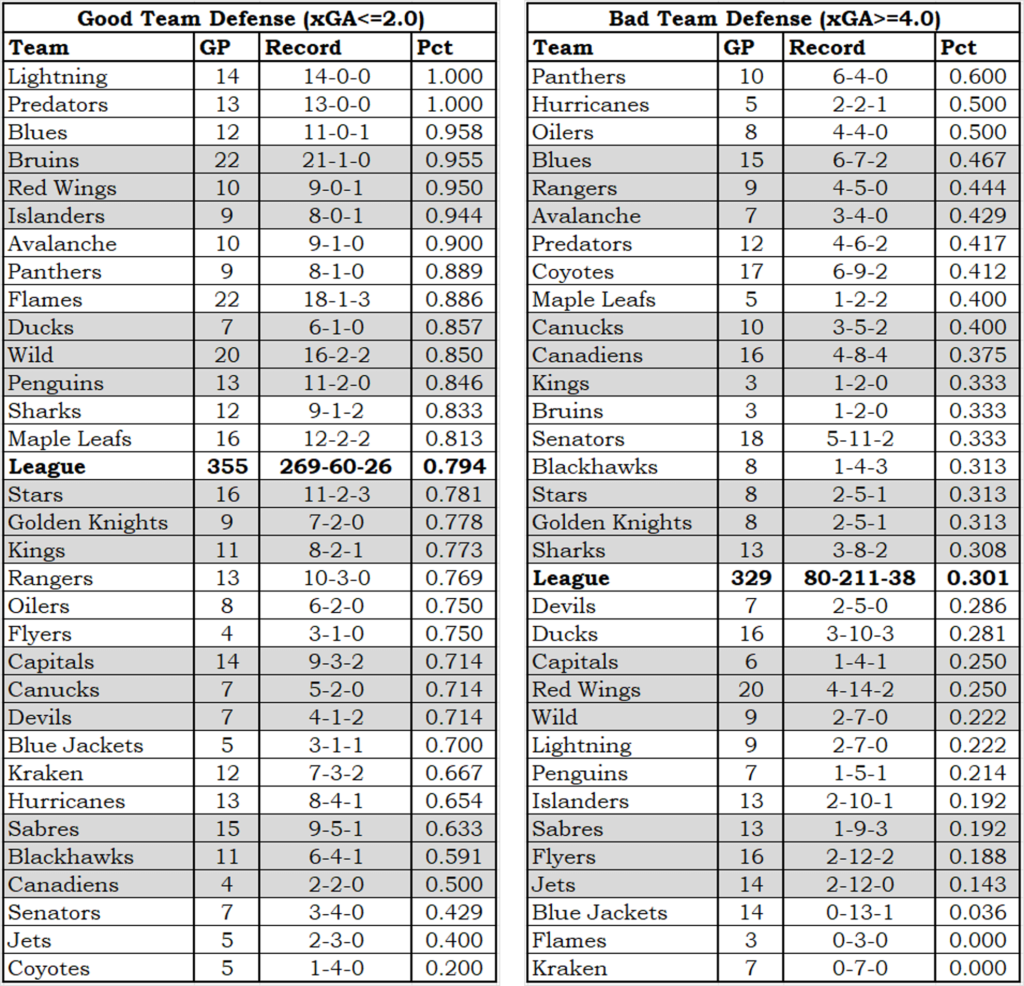
For these tables I used game-level expected goal data. A shot taken near the net has a higher expectation of scoring than a shot taken from the blue line.
Looks like you have to play defence to win.
Team Offensive Effort
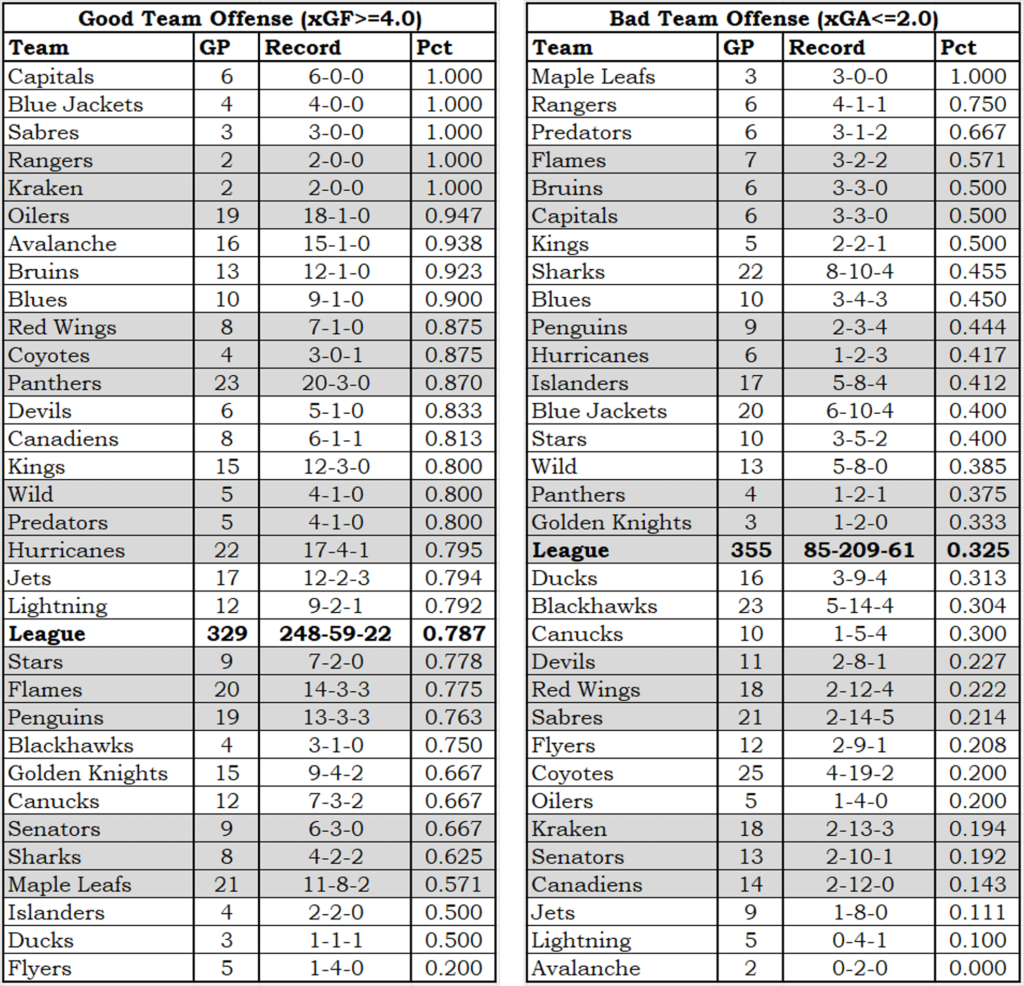
You’ll notice that the league game totals agree with the Defensive effort tables. That’s because every time a team has an expected goals against of 4.0 or more, the team they were playing has an expected goals for of 4.0 or more.
Looks like you have to score to win.
Goalie Play
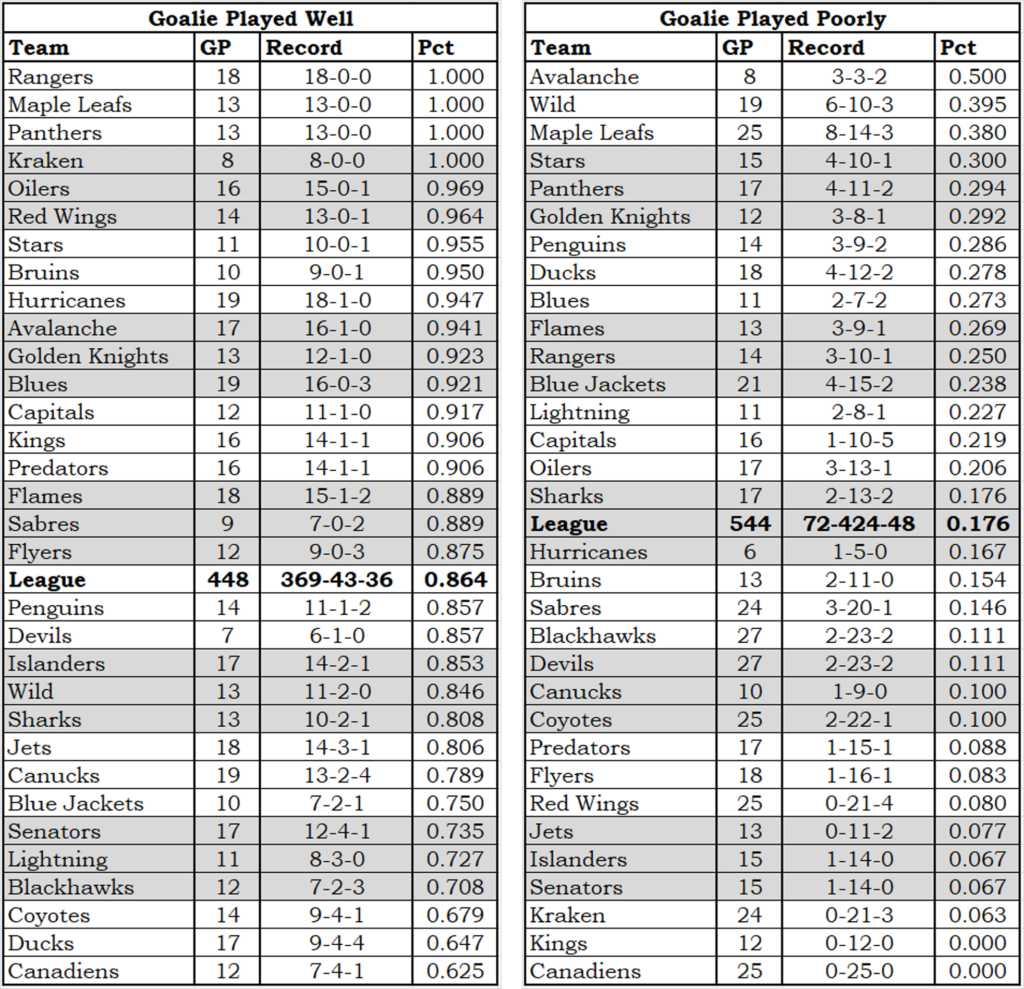
A goalie played well if the goals he gave up was at least 1.5 less than the expected goals total. A goalie played poorly if he gave up at least 1.5 more goals than expected. The data is a little unfair to the goalies, because nothing in the data that I used indicates goals scored into empty nets.
The league results for points percentage here (0.864 vs. 0.176) are more extreme than for team defensive effort (0.794 vs. 0.301). A great goalie performance can produce a win the team didn’t deserve, and a poor goalie performance can mean a team will lose a game it should have won.
Faceoffs and Blocked Shots
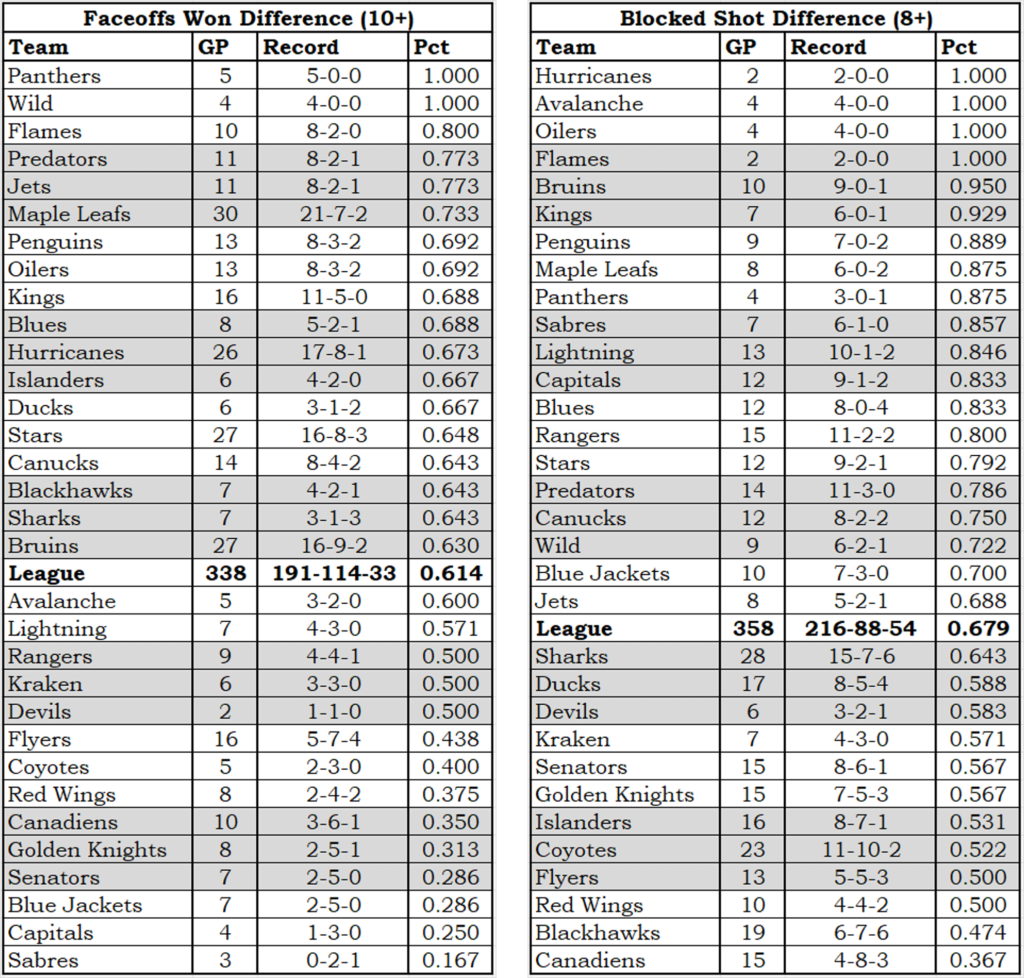
I’m sure I’ve written in one of (if not several of) the other articles that faceoff winning percentage is not that important. I stand by that position, in spite of the data above.
Faceoff winning percentage makes little difference over the course of a season. In a specific game, winning a lot more faceoffs is obviously a good thing.
Colorado was tied for 28th in the league for faceoff win percent at 47%. That basically proves that over the course of a season faceoff winning percentage is not that important: the Stanley Cup says so.
Hits
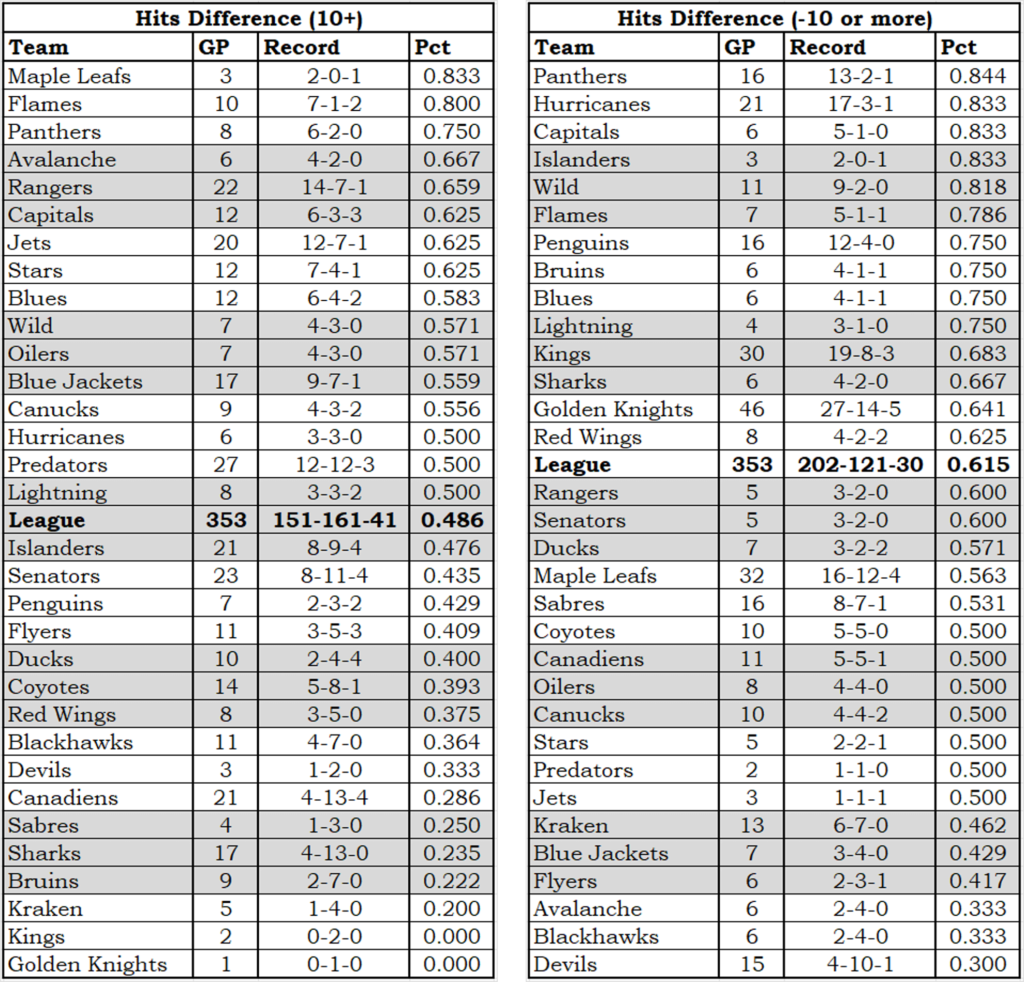
A team that really outhits their opponents in a game tends to lose the game. I interpret this to mean that teams that are losing games increase their hitting rate. Hits do not lead to winning; losing leads to hits.
Hit data at the team level is extremely suspect. There are huge variations in game-level hit totals of some teams based on whether they are playing at home or on the road, suggesting (or proving) that different official scorers have different understandings of what a hit is.
I’m not a betting man, but I’d bet this little tidbit of information will lead to an article on hits and/or potential biases in the game data.