
I’ll be presenting lists of players based on statistics that aren’t easily available online. If you want to see the top scorers in the league, you don’t need me to do that for you: it can easily be done on NHL.com or on NaturalStatTrick.com.
Cathal Kelly, sportswriter extraordinaire for the Toronto Globe and Mail, has a book out called Boy Wonders. It is a series of short stories on events in his life as he grew up in Toronto, the son of Catholic Irish parents. It is worth reading.
A quote from his book: “In journalism, lists are considered the lowest form of literature, tucked in behind streeters and notes columns. A list is what you print in August when everyone’s on vacation and you can’t come up with anything better.”
Well, that puts this article in its place, doesn’t it?
Most Valuable Player
The single most important reason to use statistics instead of voting to recognize player accomplishments was demonstrated in this year’s NHL awards ceremony. In what was the most egregious idiocy, a sportswriter who will go unnamed placed Connor McDavid fifth. All other voters had McDavid first, so he cost McDavid a unanimous award.
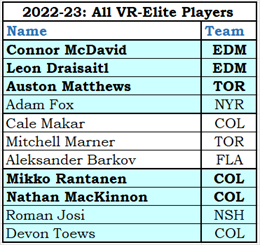
My list is based on Value Rating (VR). Only five of the players on it, those in bold font, received votes for the NHL MVP: it is obvious that the NHL and I define valuable differently. The idiot’s choice for MVP, David Pastrnak, isn’t on my list. He was the 31st most valuable player in the league based on Value Rating.
As to whether said voter should retain rights to vote in the future, it wasn’t too long ago that the fans themselves voted John Scott into the All-Star game. People who live in glass houses shouldn’t throw stones.
Most Productive Players
As there were eleven VR-Elite players, the following list shows the top eleven most productive players in 2022-23.
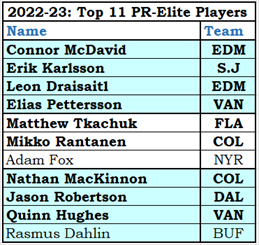
Nine of the eleven players on this list received votes for the Hart trophy, which greatly clarifies the differences the NHL and I have over the term “valuable.” The NHL term “valuable” is about the same thing as STTB’s term “productive:” it is a one-year evaluation of a player’s performance. For me, value takes three years to establish.
Highest Ranked Player on Each Team (Productivity Rating)
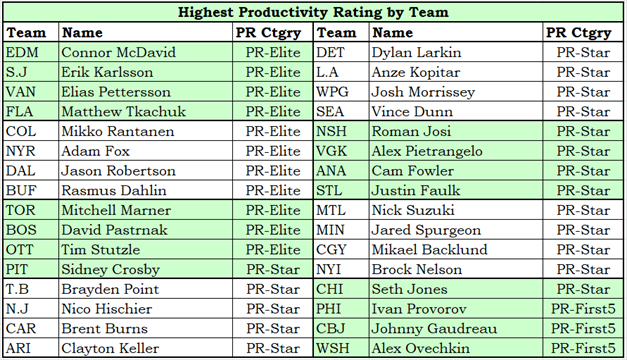
The following table shows the highest-rated player on each team. Within the table, players are sorted by PR-Score. The sixteen highest players are on the left and the next sixteen are on the right.
Rookie of the Year
I have already published an article on this season’s Rookie of the Year award. The article was published before the ceremony was held and correctly predicted that the wrong player would win the award. My list of the top eleven rookies follows.
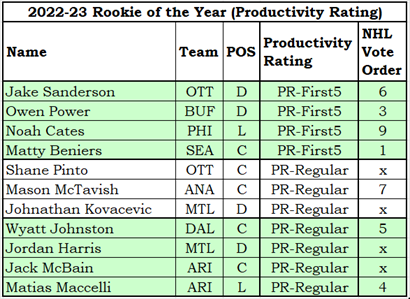
Beniers played for the best team of any of my top four rookies, which I feel had an impact on the voting. Many people look at individual awards through a “team-focus” lens: if the player’s team did poorly, a player’s achievements are discounted; if the team played well, a player’s achievements are magnified.
The voting for MVP and Rookie of the Year demonstrates two problems with voting for awards. In the MVP voting, one idiot made stupid selections in order to bring attention to himself. It isn’t the first time he has done it, and one wonders why on earth he is allowed to continue voting. In the Rookie of the Year voting, the majority of voters were mistaken (you can fool most of the people some of the time).
Stepping Down the PR Scale
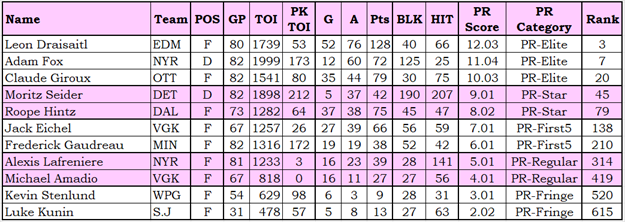
The list above shows selected statistics for eleven players who were chosen for the table because their PR-Scores were about 1.00 PR-Points different from the players immediately beside them in the table. I used a table like this when I was perfecting the PR formula, as the players should go from best to worst as you go down the table.
I should clarify one thing: it’s not that the players are worse as you go down, it is that their seasons are worse.
Odd PR-Scores put a player in the middle of a category, while even PR-Scores put a player at the bottom of a category. For example, the PR-Star category is for players whose PR-Score is between 8.0000 and 9.9999. Moritz Seider would still have been a PR-Star had he scored two fewer goals. Roope Hintz would have dropped to PR-First5 had he scored two fewer goals.
The Rank column shows where the player ranked in the league: Draisaitl was 3rd in the NHL, Frederick Gaudreau 210th. The rank shows how rare the air is at the top of the standings, compared to the middle and bottom. Dropping 2.00 PR-Points from Draisaitl brings you to Giroux, who is 20th in the league. Counting Giroux, that 2.00 PR-Point drop covered seventeen players. Dropping 2.00 PR-Points from Gaudreau to Amadio covered 200 players (209, precisely).
Alexis Lafreniere was in the middle of the PR-Regular category, and it was the best season of his career. While it is still early, it is starting to look like he will never be the first-line player that the Rangers were expecting to get from their first overall draft pick.
The bottom few entries show that the lower-rated players tend not to play anywhere close to full seasons. That isn’t always the case, of course: there are players who play lots of games and end up in the PR-Fringe category.
PR-Fringe Players
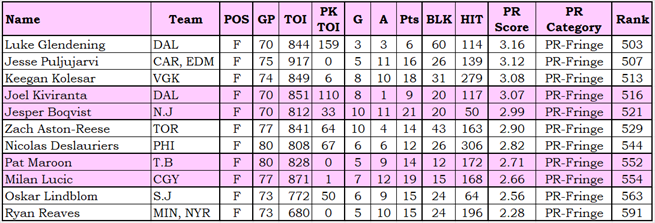
What sort of player is in the PR-Fringe category? By and large, it is full of players who didn’t play many games which resulted in them having unimpressive season statistics. A player who scored ten goals in 41 games is not evaluated as a 20-goal scorer (his season ‘pace’ for goals). A player gets the same PR-Points for scoring ten goals, whether he played 41 games or 70 games.
The table at the start of this section shows the lowest-rated players who played at least 70 games. They are all forwards, they did not get much ice time in the games they played, and they didn’t score much. Only two of them scored as many as ten goals.
Hard-core PR-Fringe players don’t play many minutes per game, they usually don’t get much penalty-kill time, they don’t score, they don’t block shots. But they hit. Well, most of them hit. And while they hit a lot, hits are the least valued statistic in the PR formula. A player with 200 hits gets 0.24 PR-Points for that, which is exactly the same reward given to a player who scored three goals. Basically, the formula says a hit is 67 times less valuable than a goal. To me, that feels like hits are over-valued in the formula.
The list has three absolute bruisers: Kolesar, Deslauriers, and Reaves. Six others play a hard game, leaving Boqvist and Lindblom as the two PR-Fringe players who don’t hit. While I’m not a fan of players who just hit (the goons), I’m also not a fan of players who don’t even hit (Boqvist and Lindblom).
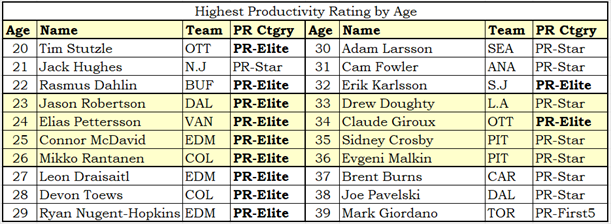
Highest Rated Player by Age
Up next is a table that shows the highest-rated players at each age from 20 to 39. PR-Elite is presented in bold font so that those players stand out.
Edmonton has three players on the list who are all PR-Elite: McDavid, Draisaitl, and Nugent-Hopkins. Several teams are on the list twice. Dallas has the pair with the widest age gap at 15 years (Robertson 23, Pavelski 38). Ottawa’s pair are separated by 14 years (Stutzle 20, Giroux 34).
Highest and Lowest Rated Forwards by Goals Scored
Please keep in mind that the lowest rated player in the NHL is approximately 345,818 times better than the best player in your beer league. They are rated lowly because they are being compared to other NHL players.
The table below shows the highest and lowest rated forwards (using PR-Score) in selected goals-scored ranges.
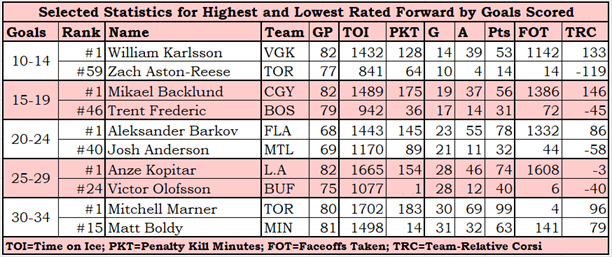
Only players who played at least 68 games in the regular season qualified for this list. I wanted players whose goal-scoring numbers truly reflected their skill. Cole Caufield (MTL) scored 26 goals on the season and had a slightly lower PR-Score than Victor Olofsson (4.33 to 4.66), but he played only 46 games.
Goals and Assists are the two biggest point producers for PR-Score, so it is no surprise that the lower-ranked players had many fewer assists than the higher-ranked players.
The lower-ranked players were not defensive stalwarts: they were rarely used on the penalty kill and were involved in faceoffs in the defensive zone less frequently than the higher-ranked players. Four of the five higher-ranked players took lots of faceoffs, as compared to zero of the five lower-ranked players.
Highest Rated Players by Jersey Number
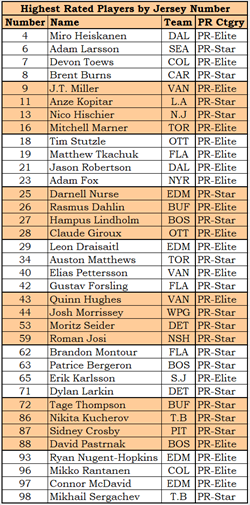
resented with apologies to those who use the pdf version of this article. I had to shrink the table to get it onto a page nicely.
There are 98 possible jersey numbers for players (1 to 98), so I immediately ruled out trying to figure out who the best player was at each jersey number. The result would have been a massive table (or probably three tables), and I do not care that a PR-Fringe player was the best to wear a non-traditional number.
I started with the player ratings instead, taking 47 players that had a PR-Score of 9.00 or more. They comprised the upper half of PR-Star (27 players) and the PR-Elite (20 players). Between them, they wore 36 different jersey numbers.
Bo Horvat qualified for the table because his PR-Score was 9.48 (PR-Star). He was disqualified because he wore two different jersey numbers during the season. He wore 53 in Vancouver, but Casey Cizikas had that number for the Islanders.
The Rise and Fall of Enforcers
In the New York Times, John Branch said, “The enforcer, sometimes mocked as a goon or euphemized as a tough guy, maybe hockey’s favorite archetype.” I come neither to praise enforcers nor to bury goons, but to observe the rise and fall of this hockey archetype.
How can tough guys be measured? Simplicity itself: penalty minutes. All tough guys garner lots of penalty minutes (PIMS): PIMS is their badge of honour. When was the last time the league leader in PIMS wasn’t a tough guy? Well, in 1967-68 the league leader in penalty minutes was Barclay Plager (STL), so it was some time before that. If ever.
I calculated the penalty minutes of the top five players in PIMS every five years, starting in 1957-58. This total was adjusted based on an 82-game season length. For example, 1957-58 was a 70-game season, so its top five PIM total of 636 was multiplied by 82/70, producing an 82-game total of 745. The chart below shows the rise and fall of the goons.
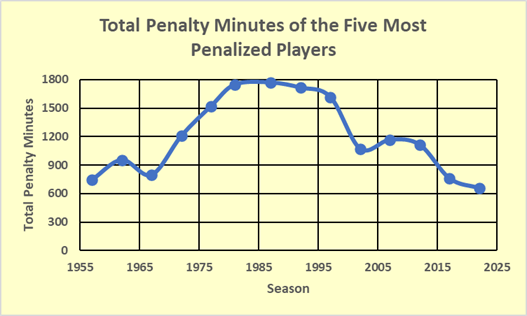
As you can see, goonery increased in the expansion period. The third point on the chart is the first expansion season, where the league doubled in size to 12 teams. The chart’s peak is the 1981-82 season when the league had 21 teams. (Note: I used 1981-82 instead of 1982-83 because 1982-83 was atypically low, and I wanted the chart to show typical PIM totals.) The decline began after the 1997-98 season when the league had 26 teams.
Why did penalty minutes increase after expansion? My opinion is that it was largely a marketing decision. The league was trying to attract American eyes to the sport, and it’s easier for new fans to watch a fight than to watch a three-on-two breakout or to understand the rules for offside.
Another factor was the expansion of the player pool: in 1997-98 there were four players for every one there was in 1966-67.
I am not going to try to change your opinion about enforcers (or goons). If you like them, you will miss them, because teams are getting rid of them.
Summary
I think Cathal Kelly was right about list articles. Good thing I do not consider myself a journalist.
Related Article