
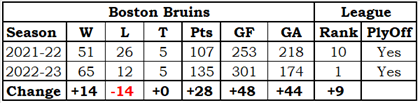
Standings
Team Record by Game Type
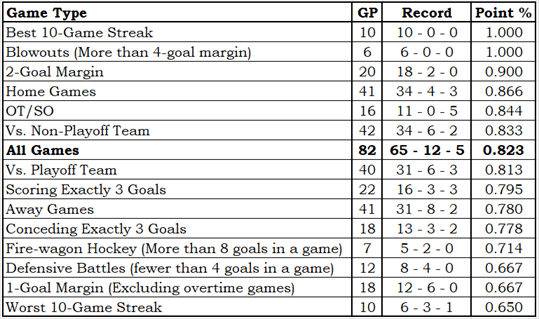
More information regarding Team Record by Game Type
The Team Record by Game Type is based on an idea I saw in a Bill James Baseball Abstract (exact year unknown; it was in an Abstract from the 1980s). It showed how a specific team did in various types of games, and it is exactly the sort of thing that I really like.
The table is sorted by point percentage (Point % column), so each team’s content order will be different and logically related game types could be well separated. Since that is the way that Bill James did it, it must be the correct way.
OT/SO is a team’s record in overtime and shootout games. These games are impossible to lose, so the loss count will always be zero. A loss is a game in which a team gets no standing points; a tie is a game in which a team gets one standing point, as they do in overtime or shootout losses.
Conceding Exactly 3 Goals and Scoring Exactly 3 Goals show how teams did in games where they scored enough to have a chance to win or conceded just enough that they could win.
1-Goal Margin, 2-Goal Margin and Blowouts (More than 4-goal margin) are for games with scores like 6-5, 6-4 and 6-1 (respectively). The 1-goal games do not include OT/SO games.
Defensive Battles and Fire-wagon Hockey are for games with scores like 2-0 and 7-3 (respectively). The entire set of Defensive Battle scores are 3-0, 2-1, 2-0 and 1-0.
Vs. Playoff Team and Vs. Non-Playoff Team are based on opponent playoff status at the end of the season, not at the time of the game. Two examples: Pittsburgh would be a non-playoff opponent and Florida would be a playoff opponent.
Best 10-Game Streak and Worst 10-Game Streak need no further explanation.
Home Games, Away Games and All Games need no further explanation.
Hide additional Information regarding Team Record by Game Type
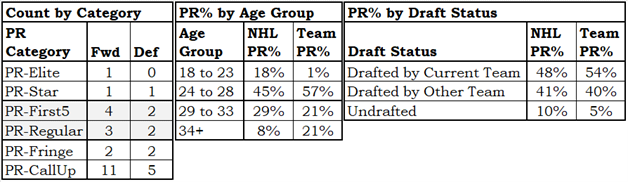
Talent Distribution
More information regarding Talent Distribution
The Talent Distribution tables show how player talent is distributed in a team.
The Count by Category table shows how many players the team has in each of the six PR Categories, broken down by position. It is good to have PR-Elite and PR-Star players.
The PR% by Age Group table shows where the team’s productivity lies by age group. For context, it also shows the league averages.
If a team has a lot of talent in the younger age groups you would think that was a good omen for the team’s future, while if the team has a lot of talent in the older age groups that would seem to be a bad omen: old players don’t get better, they get worse.
The PR% by Draft Status shows how a team acquired the talent they have, by one of three categories: they drafted the player, another team drafted the player, or the player was undrafted. In order to provide a little context, league averages are also shown.
This information is more “how a team got their talent” than “how a team should get its talent.”
It would be nice if the players a team drafts do well and stay with the team, but it is also nice to acquire talent from other teams, and it is also nice to sign an undrafted free agent.
Hide additional Information regarding Talent Distribution
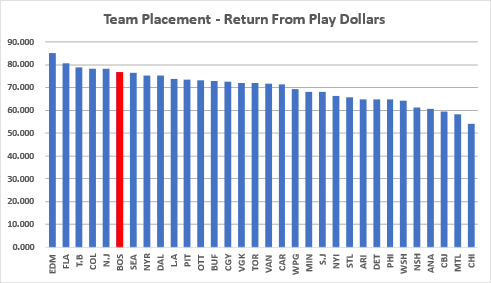
Return From Play Dollars
More information regarding Return From Play Dollars
Return From Play (RFP) translates a player’s Productivity Rating into a dollar amount that is loosely based on the 2021-22 salary cap. It has nothing to do with how much a player was paid: it is about how much a player was worth.
We do this sort of thing all the time. “They charged me $10 for the hamburger, but it tasted like a $30 steak.” “I bought my used car for $10,000, but it rides like a $50,000 car.” “I paid $500 a night for a hotel in Toronto; the place might have been worth $200.”
In 2022-23, Zach Hyman (EDM) was in the PR-Star category and had a PR-Score of 8.6554. His RFP was $7,040,000, based on his PR-Score. Essentially, he played like a $7-million player.
Seasonal RFPs can be added together, producing a total RFP for a player over time. Auston Matthew’s (TOR) return from play in his career is $55,920,000.
The RFP of all players on a team can be added together, telling us something about the level of talent on it. Colorado’s RFP in 2022-23 was $78,340,000, while the RFP of Columbus was $59,455,000. Colorado had the better players.
Hide additional Information regarding Return From Play Dollars
Lines and Pairs
More information regarding Lines & Pairs
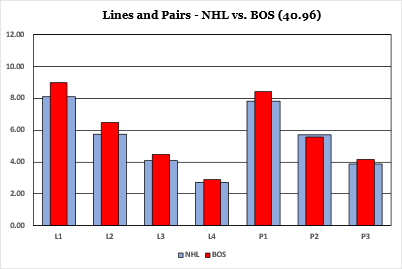
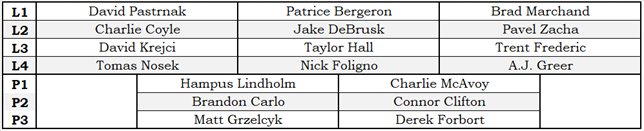
The Lines and Pairs section consists of the chart above and the table below. The chart shows where the team’s talents are in comparison to the league average, while the table shows which players are on which forward line or which defensive pair.
Players are sorted by team, by position and by their PR-Score. Traded players will use have their PR-Score apportioned based on how many games they played with each team. A player who played 50 games with one team and 25 games with a second team will be assigned 2/3 of his PR-Score for the team he played 50 games for, and 1/3 of his PR-Score for the team he played 25 games for.
The top three forwards are identified as the first line, the next three as the second line, and so on. There is no guarantee that any line has actually played even one second together during the season: the lines and pairs are solely based on productivity rating.
There are times when a player who was traded at the trade deadline will appear on the L&P table for both teams he played for. That just means that he was one of the top twelve forwards (or top six defensemen) for both teams, based on the statistics he accumulated with each team.
Hide Information regarding Lines & Pairs
Team Leaders – Stapled To The Bench Categories
More information regarding Team Leaders – Stapled To The Bench Categories
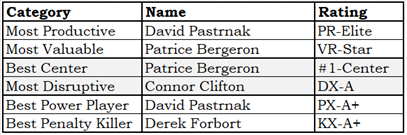
The Team Leader table identifies the best player on the team in six Stapled To The Bench categories. I will not go into the formulas used.
- The Most Productive player is the player with the highest PR-Score.
- The Most Valuable player is the player with the highest VR-Score.
- The Best Center is the player who was their team’s most highly rated center.
- The Most Disruptive player is based on blocked shots, hits and take-aways.
- The Best Power Player is based on both individual and team statistics that comes from powerplay time-on-ice.
- The Best Penalty Killer is based on statistics that comes from short-handed time-on-ice.
Hide additional Information regarding Team Leaders – Stapled To The Bench Categories
Team Leaders – On-Ice Situations
More information regarding Team Leaders – On-Ice Situations
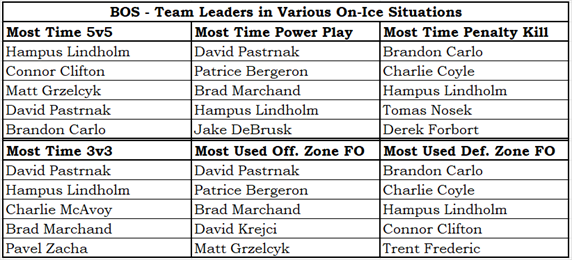
- The Team Leaders for various On-Ice situations table shows the players who got the most ice-time in certain situations.
- In the time categories, players are ranked by ice-time (in minutes played) over the season, not on ice-time per game played.
- A player who is normally heavily used in a certain situation but who missed a non-trivial number of games could fall out of the top five for his team.
- The two non-time categories show players ranked by the percent of their shifts that started in offensive or defensive zones.
- While I normally prefer to use actual counts, it seemed correct for these two categories to use percentages, provided they played a minimum number of minutes during the season.
- A minimum-time criteria avoids avoid identifying a player who played one or two games during the season as being one of the most heavily used offensive zone or defensive zone players.
Hide Information regarding Team Leaders – On-Ice Situations
Team Essay – New Indexes
As you will see in the chart below, Boston did extremely well in both preventing goals against and increasing goals for. The left columns shows expected goals (for and against), while the right columns show actual goals.
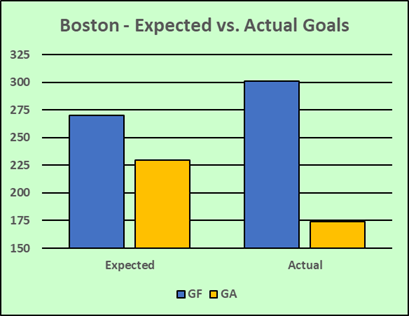
How much did this help Boston? Had Boston scored and conceded goals at the expected rate, they would have finished the season with 105 points: they actually finished with 135 points, so their excellent play got them 30 extra points. The teams that came second and third highest in this measure were Vegas and Nashville, who earned 15 and 14 extra points respectively. Let’s look into Boston’s play in two specific areas: goalies and shooters.
Goalies
The team in front of a goalie will reduce shot attempts and/or reduce the value of those shots. Both of these approaches would result in a decrease in expected goals against. Goalies can be measured on how well they did compared to the shots that made it through the team, by comparing expected goals against to actual goals against.
For example, consider the Dallas Stars and the New York Islanders. Dallas gave up 215 goals on the season while the Islanders gave up 217, and I’m here to tell you that the Islander goalies played much better than the Star goalies. The chart below shows why.
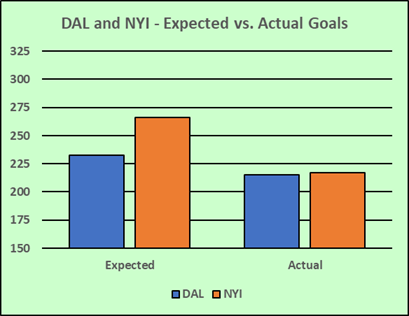
The Islander goalies gave up two more goals than the Star goalies, but were expected to give up 34 more goals: the Islander goalies were 32 goals better than the Dallas goalies over the regular season. In the next chart, Boston has replaced Dallas.
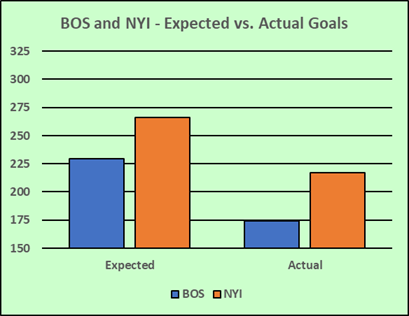
Both the Islanders and the Bruins gave up considerably fewer goals than expected, with Boston having the edge: Boston gave up 55.64 fewer goals while the Islanders gave up 49.43 fewer.
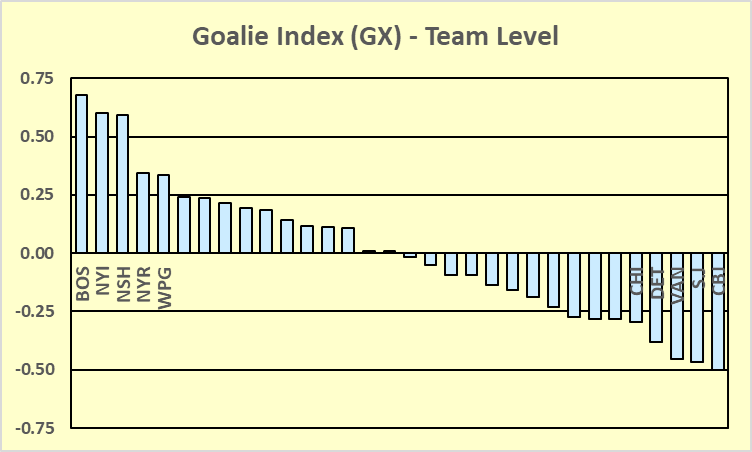
The final table for goalie play shows GX for all the teams, where GX is “goals saved above average per 60 minutes.”
Shooters
Boston did not have the deadliest set of shooters in the league, as both Seattle and St. Louis scored more frequently than expected. Third place is nothing to sneeze at.
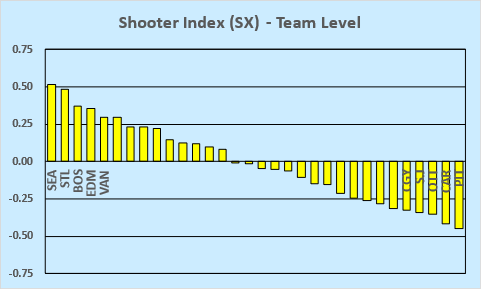
Boston was the only team in the league that was in the top five for both Goalie Index and Shooter Index. For a contrast, San Jose was the only team in the bottom five.
Boston’s article is the 32nd and final season review article for 2022-23. As a result of having done these reviews, I believe I will be modifying the PR formula and two new rating systems will be created: Goalie Rating (GR) and Shooter Rating (SR).