
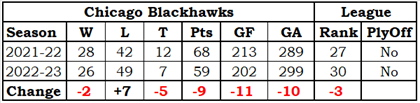
Standings
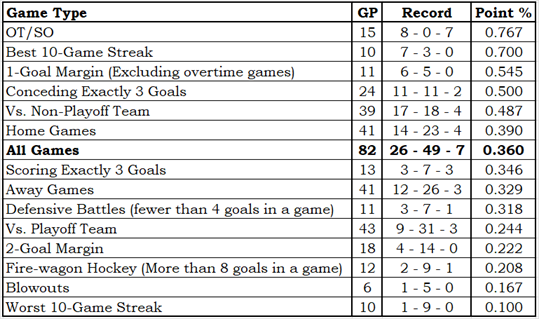
Team Record by Game Type
More information regarding Team Record by Game Type
The Team Record by Game Type is based on an idea I saw in a Bill James Baseball Abstract (exact year unknown; it was in an Abstract from the 1980s). It showed how a specific team did in various types of games, and it is exactly the sort of thing that I really like.
The table is sorted by point percentage (Point % column), so each team’s content order will be different and logically related game types could be well separated. Since that is the way that Bill James did it, it must be the correct way.
OT/SO is a team’s record in overtime and shootout games. These games are impossible to lose, so the loss count will always be zero. A loss is a game in which a team gets no standing points; a tie is a game in which a team gets one standing point, as they do in overtime or shootout losses.
Conceding Exactly 3 Goals and Scoring Exactly 3 Goals show how teams did in games where they scored enough to have a chance to win or conceded just enough that they could win.
1-Goal Margin, 2-Goal Margin and Blowouts (More than 4-goal margin) are for games with scores like 6-5, 6-4 and 6-1 (respectively). The 1-goal games do not include OT/SO games.
Defensive Battles and Fire-wagon Hockey are for games with scores like 2-0 and 7-3 (respectively). The entire set of Defensive Battle scores are 3-0, 2-1, 2-0 and 1-0.
Vs. Playoff Team and Vs. Non-Playoff Team are based on opponent playoff status at the end of the season, not at the time of the game. Two examples: Pittsburgh would be a non-playoff opponent and Florida would be a playoff opponent.
Best 10-Game Streak and Worst 10-Game Streak need no further explanation.
Home Games, Away Games and All Games need no further explanation.
Hide additional Information regarding Team Record by Game Type
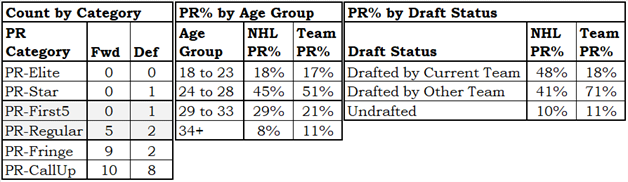
Talent Distribution
More information regarding Talent Distribution
The Talent Distribution tables show how player talent is distributed in a team.
The Count by Category table shows how many players the team has in each of the six PR Categories, broken down by position. It is good to have PR-Elite and PR-Star players.
The PR% by Age Group table shows where the team’s productivity lies by age group. For context, it also shows the league averages.
If a team has a lot of talent in the younger age groups you would think that was a good omen for the team’s future, while if the team has a lot of talent in the older age groups that would seem to be a bad omen: old players don’t get better, they get worse.
The PR% by Draft Status shows how a team acquired the talent they have, by one of three categories: they drafted the player, another team drafted the player, or the player was undrafted. In order to provide a little context, league averages are also shown.
This information is more “how a team got their talent” than “how a team should get its talent.”
It would be nice if the players a team drafts do well and stay with the team, but it is also nice to acquire talent from other teams, and it is also nice to sign an undrafted free agent.
Hide additional Information regarding Talent Distribution
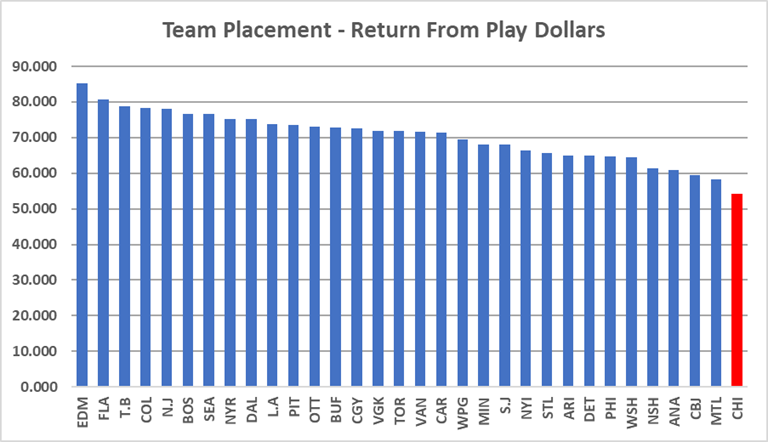
Return From Play Dollars
More information regarding Return From Play Dollars
Return From Play (RFP) translates a player’s Productivity Rating into a dollar amount that is loosely based on the 2021-22 salary cap. It has nothing to do with how much a player was paid: it is about how much a player was worth.
We do this sort of thing all the time. “They charged me $10 for the hamburger, but it tasted like a $30 steak.” “I bought my used car for $10,000, but it rides like a $50,000 car.” “I paid $500 a night for a hotel in Toronto; the place might have been worth $200.”
In 2022-23, Zach Hyman (EDM) was in the PR-Star category and had a PR-Score of 8.6554. His RFP was $7,040,000, based on his PR-Score. Essentially, he played like a $7-million player.
Seasonal RFPs can be added together, producing a total RFP for a player over time. Auston Matthew’s (TOR) return from play in his career is $55,920,000.
The RFP of all players on a team can be added together, telling us something about the level of talent on it. Colorado’s RFP in 2022-23 was $78,340,000, while the RFP of Columbus was $59,455,000. Colorado had the better players.
Hide additional Information regarding Return From Play Dollars
Lines and Pairs
More information regarding Lines & Pairs
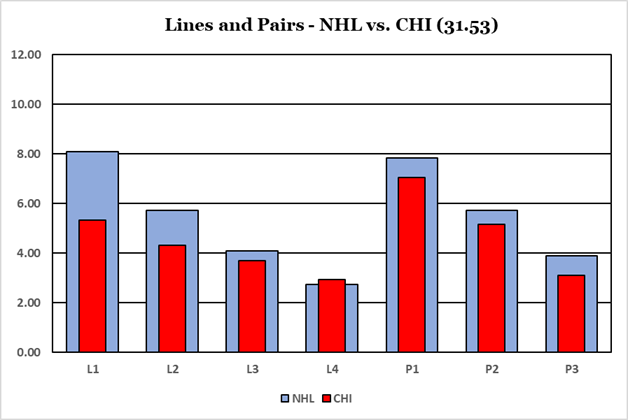
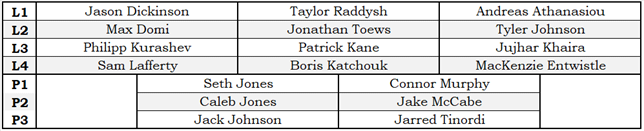
The Lines and Pairs section consists of the chart above and the table below. The chart shows where the team’s talents are in comparison to the league average, while the table shows which players are on which forward line or which defensive pair.
Players are sorted by team, by position and by their PR-Score. Traded players will use have their PR-Score apportioned based on how many games they played with each team. A player who played 50 games with one team and 25 games with a second team will be assigned 2/3 of his PR-Score for the team he played 50 games for, and 1/3 of his PR-Score for the team he played 25 games for.
The top three forwards are identified as the first line, the next three as the second line, and so on. There is no guarantee that any line has actually played even one second together during the season: the lines and pairs are solely based on productivity rating.
There are times when a player who was traded at the trade deadline will appear on the L&P table for both teams he played for. That just means that he was one of the top twelve forwards (or top six defensemen) for both teams, based on the statistics he accumulated with each team.
Hide Information regarding Lines & Pairs
Team Leaders – Stapled To The Bench Categories
More information regarding Team Leaders – Stapled To The Bench Categories
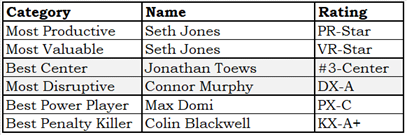
The Team Leader table identifies the best player on the team in six Stapled To The Bench categories. I will not go into the formulas used.
- The Most Productive player is the player with the highest PR-Score.
- The Most Valuable player is the player with the highest VR-Score.
- The Best Center is the player who was their team’s most highly rated center.
- The Most Disruptive player is based on blocked shots, hits and take-aways.
- The Best Power Player is based on both individual and team statistics that comes from powerplay time-on-ice.
- The Best Penalty Killer is based on statistics that comes from short-handed time-on-ice.
Hide additional Information regarding Team Leaders – Stapled To The Bench Categories
Team Leaders – On-Ice Situations
More information regarding Team Leaders – On-Ice Situations
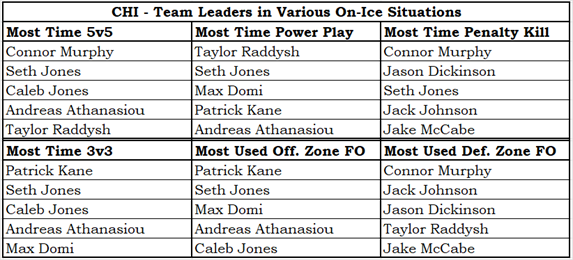
- The Team Leaders for various On-Ice situations table shows the players who got the most ice-time in certain situations.
- In the time categories, players are ranked by ice-time (in minutes played) over the season, not on ice-time per game played.
- A player who is normally heavily used in a certain situation but who missed a non-trivial number of games could fall out of the top five for his team.
- The two non-time categories show players ranked by the percent of their shifts that started in offensive or defensive zones.
- While I normally prefer to use actual counts, it seemed correct for these two categories to use percentages, provided they played a minimum number of minutes during the season.
- A minimum-time criteria avoids avoid identifying a player who played one or two games during the season as being one of the most heavily used offensive zone or defensive zone players.
Hide Information regarding Team Leaders – On-Ice Situations
Team Essay – Return From Play
This essay doesn’t have much to do with Chicago, really. I noticed something about Return From Play (RFP) while looking for something to say about Chicago. As you can see from the RFP chart earlier in this article, Chicago had the lowest RFP in the league, meaning they got the least productive play from their skaters of any team in the league. So let us talk a little about RFP and Productivity Rating (PR), from which RFP is generated.
RFP was created because it put the abstract numbers of PR-Scores into the relatable numbers of NHL salary dollars. It struck me as more meaningful to say the team played like its salary was $54,210,000 than its PR-Score total was 102.47. If you know anything about NHL team salary rules, you know that $54 million is a low total and you could sense that a team with that salary would have poor results. If you knew a lot about PR-Score, knowing that the team total PR-Score was 102.47 would be meaningless by itself: you’d need to know the PR-Scores of the other teams to get useful context.
As I was looking at 2022-23 RFP data at the team level, I wondered how tightly it was related to goals scored and goals allowed at the team level. A scatter chart is just the thing to show how related goals were to RFP, and it is shown below. The blue dots are goals for and the red dots are goals against.
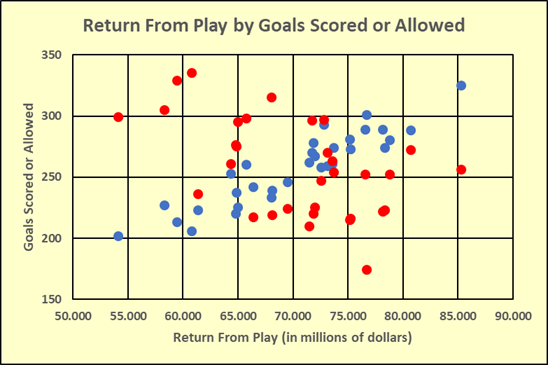
The blue dots are in a line from the bottom left of the chart to the top right: as goals for increases, so does RFP. The red dots are scattered randomly all over the chart, as if a painter was sloppy with his paintbrush. This chart shows us that goals allowed have little to no impact on PR-Score and RFP.
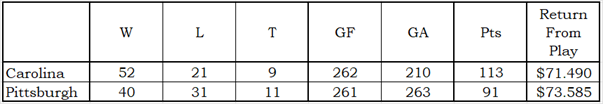
Now let’s look at two teams who scored similar amounts of goals but allowed vastly different amounts of goals: Carolina and Pittsburgh. Carolina scored one more goal than Pittsburgh, but the Penguins allowed 53 more goals against. Carolina easily made the playoffs, Pittsburgh missed the playoffs, and yet Pittsburgh has a higher RFP.
As William Hughs (the prime minister of Australia from 1915 to 1923) might say, “That ain’t right, dog.”
Can PR score be improved? It isn’t particularly difficult to play with the PR-Score formula, with the minor issue that I didn’t keep GF and GA at the player level in my copy of the data (as I decided not to use plus/minus). The results of an improved formula are easy to project. The players on Chicago would all get lower PR-Scores (because Chicago gave up more goals than they scored) and the players on Boston and Edmonton would all get higher PR-Scores. The rich would get richer, the poor would get poorer.
It is a quandary for me, as I don’t want to update fifteen seasons of data and throw out dozens of articles that use the current version of PR-Score, VR-Score or RFP. I also don’t want to use a lesser PR-Score when a better version could be had. Another drawback to investigating the PR-Score formula is that it would take a lot of my time, time that could be spent more productively on the golf course.
Chicago was a bad team in 2022-23, and their players’ PR-Scores reflect that, and the team’s RFP reflects that. While somewhat flawed, the PR calculations generally work. They don’t produce perfect ratings (as shown in the Carolina-Pittsburgh discussion), but I never thought they produced perfect ratings.
It is said that close only counts in horseshoes and hand grenades; I believe that close also counts rating systems for players of major professional sports. PR-Score is accurate enough for hockey players, WAR (wins above replacement) is accurate enough for baseball players and QBR (quarterback rating) is accurate enough in football quarterbacks. None of those ratings are fingerprint-perfect, but all are close enough that their ratings are acceptable.