
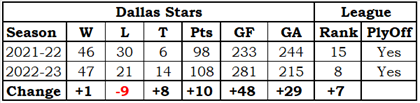
Standings
Team Record by Game Type
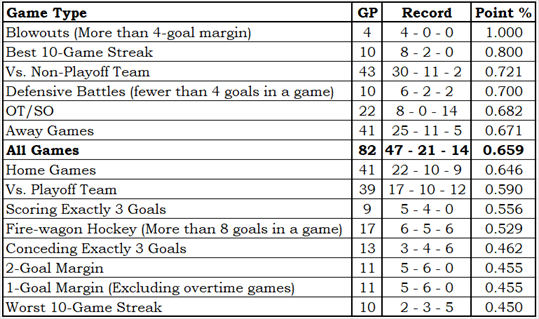
More information regarding Team Record by Game Type
The Team Record by Game Type is based on an idea I saw in a Bill James Baseball Abstract (exact year unknown; it was in an Abstract from the 1980s). It showed how a specific team did in various types of games, and it is exactly the sort of thing that I really like.
The table is sorted by point percentage (Point % column), so each team’s content order will be different and logically related game types could be well separated. Since that is the way that Bill James did it, it must be the correct way.
OT/SO is a team’s record in overtime and shootout games. These games are impossible to lose, so the loss count will always be zero. A loss is a game in which a team gets no standing points; a tie is a game in which a team gets one standing point, as they do in overtime or shootout losses.
Conceding Exactly 3 Goals and Scoring Exactly 3 Goals show how teams did in games where they scored enough to have a chance to win or conceded just enough that they could win.
1-Goal Margin, 2-Goal Margin and Blowouts (More than 4-goal margin) are for games with scores like 6-5, 6-4 and 6-1 (respectively). The 1-goal games do not include OT/SO games.
Defensive Battles and Fire-wagon Hockey are for games with scores like 2-0 and 7-3 (respectively). The entire set of Defensive Battle scores are 3-0, 2-1, 2-0 and 1-0.
Vs. Playoff Team and Vs. Non-Playoff Team are based on opponent playoff status at the end of the season, not at the time of the game. Two examples: Pittsburgh would be a non-playoff opponent and Florida would be a playoff opponent.
Best 10-Game Streak and Worst 10-Game Streak need no further explanation.
Home Games, Away Games and All Games need no further explanation.
Hide additional Information regarding Team Record by Game Type
Talent Distribution
More information regarding Talent Distribution
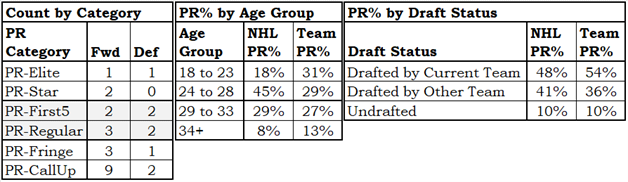
The Talent Distribution tables show how player talent is distributed in a team.
The Count by Category table shows how many players the team has in each of the six PR Categories, broken down by position. It is good to have PR-Elite and PR-Star players.
The PR% by Age Group table shows where the team’s productivity lies by age group. For context, it also shows the league averages.
If a team has a lot of talent in the younger age groups you would think that was a good omen for the team’s future, while if the team has a lot of talent in the older age groups that would seem to be a bad omen: old players don’t get better, they get worse.
The PR% by Draft Status shows how a team acquired the talent they have, by one of three categories: they drafted the player, another team drafted the player, or the player was undrafted. In order to provide a little context, league averages are also shown.
This information is more “how a team got their talent” than “how a team should get its talent.”
It would be nice if the players a team drafts do well and stay with the team, but it is also nice to acquire talent from other teams, and it is also nice to sign an undrafted free agent.
Hide additional Information regarding Talent Distribution
Return From Play Dollars
More information regarding Return From Play Dollars
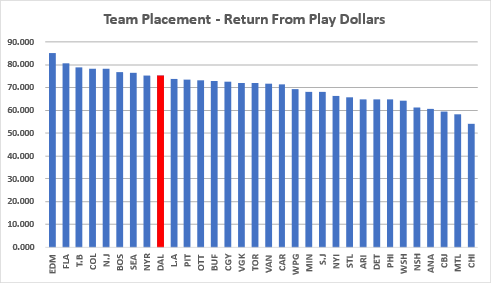
Return From Play (RFP) translates a player’s Productivity Rating into a dollar amount that is loosely based on the 2021-22 salary cap. It has nothing to do with how much a player was paid: it is about how much a player was worth.
We do this sort of thing all the time. “They charged me $10 for the hamburger, but it tasted like a $30 steak.” “I bought my used car for $10,000, but it rides like a $50,000 car.” “I paid $500 a night for a hotel in Toronto; the place might have been worth $200.”
In 2022-23, Zach Hyman (EDM) was in the PR-Star category and had a PR-Score of 8.6554. His RFP was $7,040,000, based on his PR-Score. Essentially, he played like a $7-million player.
Seasonal RFPs can be added together, producing a total RFP for a player over time. Auston Matthew’s (TOR) return from play in his career is $55,920,000.
The RFP of all players on a team can be added together, telling us something about the level of talent on it. Colorado’s RFP in 2022-23 was $78,340,000, while the RFP of Columbus was $59,455,000. Colorado had the better players.
Hide additional Information regarding Return From Play Dollars
Lines and Pairs
More information regarding Lines & Pairs
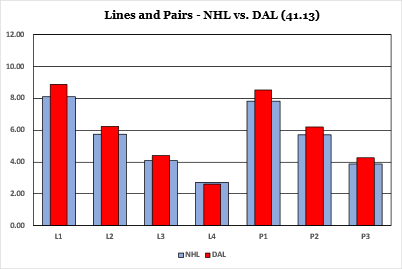
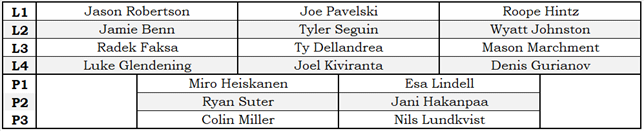
The Lines and Pairs section consists of the chart above and the table below. The chart shows where the team’s talents are in comparison to the league average, while the table shows which players are on which forward line or which defensive pair.
Players are sorted by team, by position and by their PR-Score. Traded players will use have their PR-Score apportioned based on how many games they played with each team. A player who played 50 games with one team and 25 games with a second team will be assigned 2/3 of his PR-Score for the team he played 50 games for, and 1/3 of his PR-Score for the team he played 25 games for.
The top three forwards are identified as the first line, the next three as the second line, and so on. There is no guarantee that any line has actually played even one second together during the season: the lines and pairs are solely based on productivity rating.
There are times when a player who was traded at the trade deadline will appear on the L&P table for both teams he played for. That just means that he was one of the top twelve forwards (or top six defensemen) for both teams, based on the statistics he accumulated with each team.
Hide Information regarding Lines & Pairs
Team Leaders – Stapled To The Bench Categories
More information regarding Team Leaders – Stapled To The Bench Categories
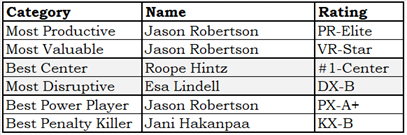
The Team Leader table identifies the best player on the team in six Stapled To The Bench categories. I will not go into the formulas used.
- The Most Productive player is the player with the highest PR-Score.
- The Most Valuable player is the player with the highest VR-Score.
- The Best Center is the player who was their team’s most highly rated center.
- The Most Disruptive player is based on blocked shots, hits and take-aways.
- The Best Power Player is based on both individual and team statistics that comes from powerplay time-on-ice.
- The Best Penalty Killer is based on statistics that comes from short-handed time-on-ice.
Hide additional Information regarding Team Leaders – Stapled To The Bench Categories
Team Leaders – On-Ice Situations
More information regarding Team Leaders – On-Ice Situations
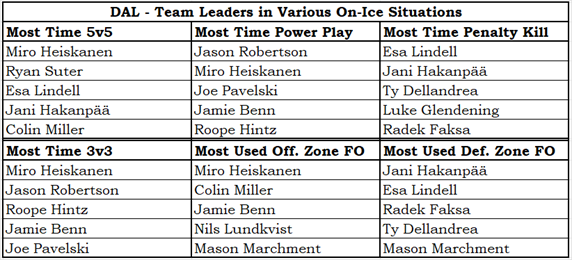
- The Team Leaders for various On-Ice situations table shows the players who got the most ice-time in certain situations.
- In the time categories, players are ranked by ice-time (in minutes played) over the season, not on ice-time per game played.
- A player who is normally heavily used in a certain situation but who missed a non-trivial number of games could fall out of the top five for his team.
- The two non-time categories show players ranked by the percent of their shifts that started in offensive or defensive zones.
- While I normally prefer to use actual counts, it seemed correct for these two categories to use percentages, provided they played a minimum number of minutes during the season.
- A minimum-time criteria avoids avoid identifying a player who played one or two games during the season as being one of the most heavily used offensive zone or defensive zone players.
Hide Information regarding Team Leaders – On-Ice Situations
Team Essay – Jay Dog
Dallas has this player you may have heard of: Jason Robertson (nicknamed Jay Dog by me, for obscure reasons). He has become more and more useful as a player these last three seasons, as his Career Productivity Rating chart shows.
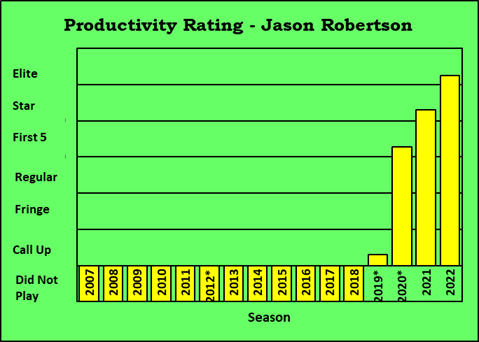
Robertson had a PR-Elite season at the age of 23. How many players can boast of that, and what do we know of their play at ages 24, 25 and 26? I thought I’d take a look.
When looking at one player’s future based on the experiences of other players, it is very important to select the correct set of “other players.” Let me show you how I found the correct set of other players.
I started with PR-Score, the numeric part of Productivity Rating. Robertson’s PR-Elite status is based on his PR-Score of 10.5014. As you can well imagine, nobody else has had exactly the same score, so I looked for players with a PR-Score between 10.0000 and 11.0000.
I found 112 players, which is a large group that is full of players who are not good matches to Robertson. As an easy example, it has 43 defensemen.
The group of 69 forwards still has poor matches. Age is such an important factor that I would be very hesitant to use a player that was even one year older or younger. The number of other forwards who are 23 years old who had a PR-Score between 10 and 11 is seven.
We now have a small group (which will soon get smaller), and the one problem with a small group is that if one person had an unusual outcome, that unusual outcome is a large part of the total outcome.
The following table shows the group sorted by PR-Score, with Jason Robertson included.
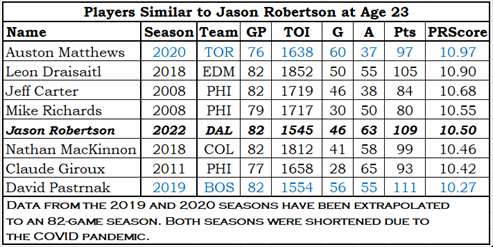
Matthews and Draisaitl were probably too good at age 23 to be considered as a close match to Robertson, intending no disrespect towards Robertson at all. The players who will be used to frame Robertson’s future are Carter, Richards, MacKinnon, Giroux and Pastrnak.
Jeff Carter’s next three season saw him rated PR-First5, PR-Star and PR-Regular. Had he played a couple of more minutes in 2009-10, his rating would have been PR-Star: his PR-Score was 7.9954 and the bottom of the PR-Star range is a PR-Score of 8.0000.
Mike Richards went PR-Star, PR-Star and PR-Regular. On BrotherlyPuck.com it says “that Richards’ career took a nose dive due to substance issues …”. Whatever the cause, the nosedive happened. Richards’ last effective season, in which he rated PR-Regular, was 2013-14.
Nathan MacKinnon: PR-Elite, PR-Star, PR-Star. In his age-27 season, 2022-23, he returned to PR-Elite status in what was his best season to date. He’s missed about 10% of scheduled games in each of the last three seasons.
Claude Giroux: PR-Elite, PR-Elite, PR-Star. Giroux came into prominence in the last season that Richards and Carter played in Philadelphia, 2010-11. All three were rated PR-Star, but Giroux had the highest PR-Score. It was the following season, 2011-12, that was the match to Robertson.
David Pastrnak: PR-First5, PR-First5, PR-Elite. Pastrnak’s age-24 and age-25 seasons were both rated PR-First5, but they also featured missed games. Had he played full seasons, both would have resulted in PR-Star ratings. Last season he played every game and was PR-Elite.
To summarize the PR-Category results of these five players:
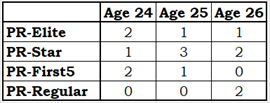
PR-Elite is a hard level of play to achieve; you have to play extremely well and you have to stay very healthy. Even the very best players don’t put up a PR-Elite season every year. Connor McDavid has been PR-Elite in six of the last seven seasons, missing PR-Elite status by a hair in a season in which he missed just a couple of games.
What is Jason Robertson’s future? To use a statistical phrase, it’s “rosy.” He should be PR-Elite or the top of the PR-Star category for the next several years, provided he stays healthy and Dallas continues to be a good team. It is unlikely that he’ll take the Carter-Richards path to PR-Regular play, but then again, it was unlikely that Carter and Richards would take that path.