
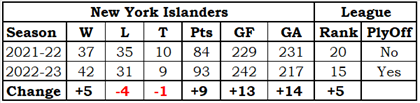
Standings
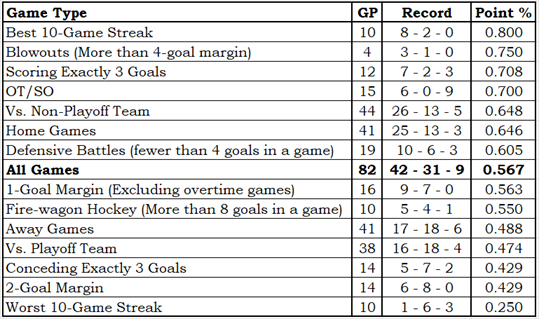
Team Record by Game Type
More information regarding Team Record by Game Type
The Team Record by Game Type is based on an idea I saw in a Bill James Baseball Abstract (exact year unknown; it was in an Abstract from the 1980s). It showed how a specific team did in various types of games, and it is exactly the sort of thing that I really like.
The table is sorted by point percentage (Point % column), so each team’s content order will be different and logically related game types could be well separated. Since that is the way that Bill James did it, it must be the correct way.
OT/SO is a team’s record in overtime and shootout games. These games are impossible to lose, so the loss count will always be zero. A loss is a game in which a team gets no standing points; a tie is a game in which a team gets one standing point, as they do in overtime or shootout losses.
Conceding Exactly 3 Goals and Scoring Exactly 3 Goals show how teams did in games where they scored enough to have a chance to win or conceded just enough that they could win.
1-Goal Margin, 2-Goal Margin and Blowouts (More than 4-goal margin) are for games with scores like 6-5, 6-4 and 6-1 (respectively). The 1-goal games do not include OT/SO games.
Defensive Battles and Fire-wagon Hockey are for games with scores like 2-0 and 7-3 (respectively). The entire set of Defensive Battle scores are 3-0, 2-1, 2-0 and 1-0.
Vs. Playoff Team and Vs. Non-Playoff Team are based on opponent playoff status at the end of the season, not at the time of the game. Two examples: Pittsburgh would be a non-playoff opponent and Florida would be a playoff opponent.
Best 10-Game Streak and Worst 10-Game Streak need no further explanation.
Home Games, Away Games and All Games need no further explanation.
Hide additional Information regarding Team Record by Game Type
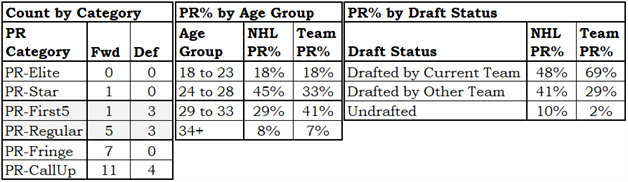
Talent Distribution
More information regarding Talent Distribution
The Talent Distribution tables show how player talent is distributed in a team.
The Count by Category table shows how many players the team has in each of the six PR Categories, broken down by position. It is good to have PR-Elite and PR-Star players.
The PR% by Age Group table shows where the team’s productivity lies by age group. For context, it also shows the league averages.
If a team has a lot of talent in the younger age groups you would think that was a good omen for the team’s future, while if the team has a lot of talent in the older age groups that would seem to be a bad omen: old players don’t get better, they get worse.
The PR% by Draft Status shows how a team acquired the talent they have, by one of three categories: they drafted the player, another team drafted the player, or the player was undrafted. In order to provide a little context, league averages are also shown.
This information is more “how a team got their talent” than “how a team should get its talent.”
It would be nice if the players a team drafts do well and stay with the team, but it is also nice to acquire talent from other teams, and it is also nice to sign an undrafted free agent.
Hide additional Information regarding Talent Distribution
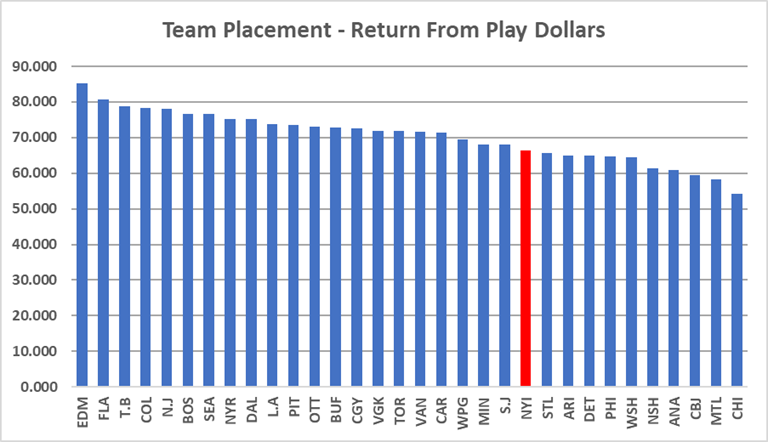
Return From Play Dollars
More information regarding Return From Play Dollars
Return From Play (RFP) translates a player’s Productivity Rating into a dollar amount that is loosely based on the 2021-22 salary cap. It has nothing to do with how much a player was paid: it is about how much a player was worth.
We do this sort of thing all the time. “They charged me $10 for the hamburger, but it tasted like a $30 steak.” “I bought my used car for $10,000, but it rides like a $50,000 car.” “I paid $500 a night for a hotel in Toronto; the place might have been worth $200.”
In 2022-23, Zach Hyman (EDM) was in the PR-Star category and had a PR-Score of 8.6554. His RFP was $7,040,000, based on his PR-Score. Essentially, he played like a $7-million player.
Seasonal RFPs can be added together, producing a total RFP for a player over time. Auston Matthew’s (TOR) return from play in his career is $55,920,000.
The RFP of all players on a team can be added together, telling us something about the level of talent on it. Colorado’s RFP in 2022-23 was $78,340,000, while the RFP of Columbus was $59,455,000. Colorado had the better players.
Hide additional Information regarding Return From Play Dollars
Lines and Pairs
More information regarding Lines & Pairs
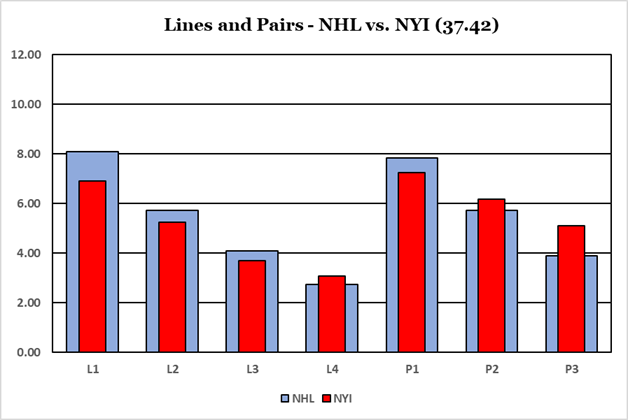
The Lines and Pairs section consists of the chart above and the table below. The chart shows where the team’s talents are in comparison to the league average, while the table shows which players are on which forward line or which defensive pair.
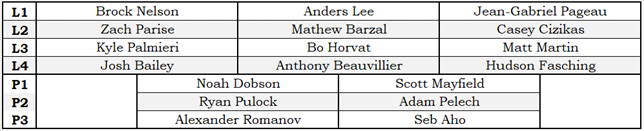
Players are sorted by team, by position and by their PR-Score. Traded players will use have their PR-Score apportioned based on how many games they played with each team. A player who played 50 games with one team and 25 games with a second team will be assigned 2/3 of his PR-Score for the team he played 50 games for, and 1/3 of his PR-Score for the team he played 25 games for.
The top three forwards are identified as the first line, the next three as the second line, and so on. There is no guarantee that any line has actually played even one second together during the season: the lines and pairs are solely based on productivity rating.
There are times when a player who was traded at the trade deadline will appear on the L&P table for both teams he played for. That just means that he was one of the top twelve forwards (or top six defensemen) for both teams, based on the statistics he accumulated with each team.
Hide Information regarding Lines & Pairs
Team Leaders – Stapled To The Bench Categories
More information regarding Team Leaders – Stapled To The Bench Categories
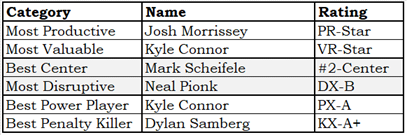
The Team Leader table identifies the best player on the team in six Stapled To The Bench categories. I will not go into the formulas used.
- The Most Productive player is the player with the highest PR-Score.
- The Most Valuable player is the player with the highest VR-Score.
- The Best Center is the player who was their team’s most highly rated center.
- The Most Disruptive player is based on blocked shots, hits and take-aways.
- The Best Power Player is based on both individual and team statistics that comes from powerplay time-on-ice.
- The Best Penalty Killer is based on statistics that comes from short-handed time-on-ice.
Hide additional Information regarding Team Leaders – Stapled To The Bench Categories
Team Leaders – On-Ice Situations
More information regarding Team Leaders – On-Ice Situations
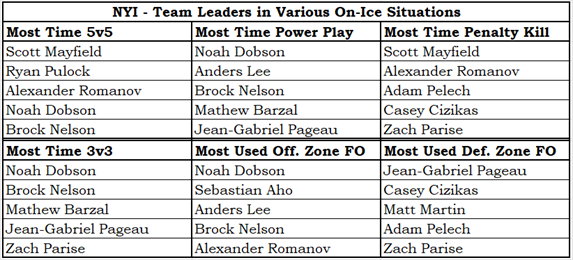
- The Team Leaders for various On-Ice situations table shows the players who got the most ice-time in certain situations.
- In the time categories, players are ranked by ice-time (in minutes played) over the season, not on ice-time per game played.
- A player who is normally heavily used in a certain situation but who missed a non-trivial number of games could fall out of the top five for his team.
- The two non-time categories show players ranked by the percent of their shifts that started in offensive or defensive zones.
- While I normally prefer to use actual counts, it seemed correct for these two categories to use percentages, provided they played a minimum number of minutes during the season.
- A minimum-time criteria avoids avoid identifying a player who played one or two games during the season as being one of the most heavily used offensive zone or defensive zone players.
Hide Information regarding Team Leaders – On-Ice Situations
Team Essay – Pre and Post Bo
On January 31st 2023, the New York Islanders acquired Bo Horvat in a trade with Vancouver. Horvat had an excellent season that saw him rated PR-Star.
At the time of the trade, the Islanders were in 10th place in the Eastern Conference with 55 points. Below is the standings at the time of the trade, which shows the predicament the Islanders were in.
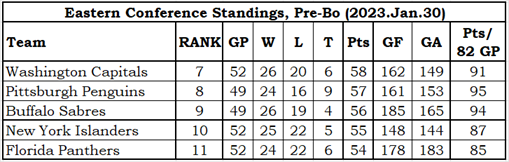
The final column, Pts/82 GP, shows how many points a team would have if the played the rest of the season at the same pace. The Islanders had to pick up their pace (or the Caps, Pens and Sabres had to drop their pace), and the Isles had to keep an eye on the Panthers who were just behind them. As you can see below, pretty much all of those requirements were met.
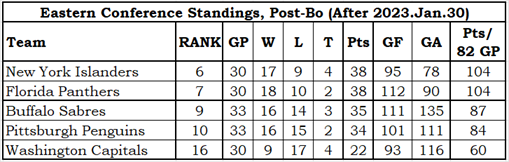
The Islanders picked up their play (as did the Panthers), the Sabres and Penguins slowed down, and the Capitals drove their team bus into a bridge abutment.
Now we get to the meat of this article. What changed for the Islanders, Post-Bo (after the acquisition of Bo Horvat)? I will strictly be looking at team-level data, and I want to stress that it is very possible that some of the changes in the Islanders had nothing to do with Bo.
In the faceoff circle the Islanders improved, going from winning 50.3% of their faceoffs to winning 54.5%. Bo is a good centre and won 56.9% of his faceoffs over the season. While a 4% increase in faceoffs sounds impressive, there are ten times as many faceoffs in a game as there are goals, and most goals happen more than 45 seconds after the preceding faceoff (that last point is an estimate by me: I don’t have the game-level data to calculate it).
With regards to hits, hitting went down Post-Bo. The Islanders delivered 3.3 hits fewer per game and took 1.2 hits fewer.
The Islanders increased their shots per game by 0.24, which is essentially no change: one extra shot on net every four games. Their shots against per game dropped 1.84, which is a slight improvement.
While their shot count didn’t change, their shooting percentage did. They went from scoring on 9.3% of their shots to scoring on 10.2% of their shots. Opponents scored on 8.7% of their shots both Pre-Bo and Post-Bo. Bo can’t claim much credit for the Islander’s increase in shooting percentage: he scored only three goals in thirty games.
Blocked shots? The Islanders blocked one fewer shot per game after Bo arrived, while their opponents blocked one more shot per game. This could have been caused by the Islanders having the puck more frequently Post-Bo.
The Islander special teams were equally effective Post-Bo as they were Pre-Bo.
The biggest change for the Islanders came in goals scored and goals against. Their average score went from 2.85-2.77 to 3.17-2.60. Their Pre-Bo goal data is at the out-of-the-playoffs level, while their Post-Bo goal data is at the easily-in-the-playoffs level.
It looks like the acquisition of Bo Horvat helped the Islanders make the playoffs, but I’m actually of two minds on that. Had the Penguins and Sabres not had bad spells, the Islanders would have been out of the playoffs with their 93 points.
Horvat’s PR-Star rating for the season was a combination of PR-Elite performance in Vancouver and PR-Regular performance on the Island. Horvat scored 38 goals on the season: 31 in 49 games in Vancouver, 7 in 30 games with the Islanders. Had he scored at his Vancouver pace in New York, he’d have finished the season as a 50-goal scorer.
Now my question is “how did Bo Horvat’s acquisition help the Islanders, given that he played significantly worse once he joined them?” Hockey is a team game, and the team absolutely played better after his arrival. The data doesn’t tell us why they played better, just that they played better. Maybe the players saw that their management thought they could make the playoffs by trading for a player (rather than trading away players), and that motivated them to play at a higher level. Bo’s impact could have been psychological.
With Thanks To My Son
I was talking to my son about this article and he doubted some facts I was using. A direct quote from him was “I’m going to have to prove you wrong”, and he brought up hockeydb.com on his phone and did prove I was wrong.
I don’t know how I made my mistake, which was that Horvat had scored 35 goals in Vancouver and only 3 in New York. When I checked NaturalStatTrick.com it had the correct numbers (31 and 7). Wikipedia also had the 31-7 split.