
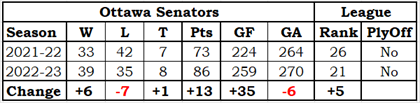
Standings
Team Record by Game Type
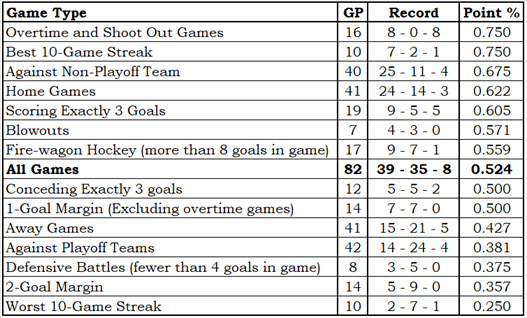
More information regarding Team Record by Game Type
The Team Record by Game Type is based on an idea I saw in a Bill James Baseball Abstract (exact year unknown; it was in an Abstract from the 1980s). It showed how a specific team did in various types of games, and it is exactly the sort of thing that I really like.
The table is sorted by point percentage (Point % column), so each team’s content order will be different and logically related game types could be well separated. Since that is the way that Bill James did it, it must be the correct way.
OT/SO is a team’s record in overtime and shootout games. These games are impossible to lose, so the loss count will always be zero. A loss is a game in which a team gets no standing points; a tie is a game in which a team gets one standing point, as they do in overtime or shootout losses.
Conceding Exactly 3 Goals and Scoring Exactly 3 Goals show how teams did in games where they scored enough to have a chance to win or conceded just enough that they could win.
1-Goal Margin, 2-Goal Margin and Blowouts (More than 4-goal margin) are for games with scores like 6-5, 6-4 and 6-1 (respectively). The 1-goal games do not include OT/SO games.
Defensive Battles and Fire-wagon Hockey are for games with scores like 2-0 and 7-3 (respectively). The entire set of Defensive Battle scores are 3-0, 2-1, 2-0 and 1-0.
Vs. Playoff Team and Vs. Non-Playoff Team are based on opponent playoff status at the end of the season, not at the time of the game. Two examples: Pittsburgh would be a non-playoff opponent and Florida would be a playoff opponent.
Best 10-Game Streak and Worst 10-Game Streak need no further explanation.
Home Games, Away Games and All Games need no further explanation.
Hide additional Information regarding Team Record by Game Type
Talent Distribution
More information regarding Talent Distribution
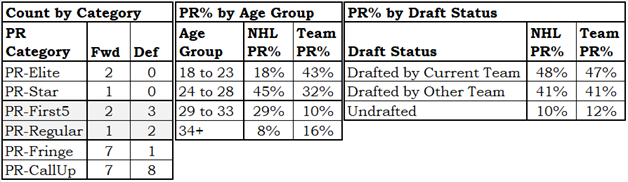
The Talent Distribution tables show how player talent is distributed in a team.
The Count by Category table shows how many players the team has in each of the six PR Categories, broken down by position. It is good to have PR-Elite and PR-Star players.
The PR% by Age Group table shows where the team’s productivity lies by age group. For context, it also shows the league averages.
If a team has a lot of talent in the younger age groups you would think that was a good omen for the team’s future, while if the team has a lot of talent in the older age groups that would seem to be a bad omen: old players don’t get better, they get worse.
The PR% by Draft Status shows how a team acquired the talent they have, by one of three categories: they drafted the player, another team drafted the player, or the player was undrafted. In order to provide a little context, league averages are also shown.
This information is more “how a team got their talent” than “how a team should get its talent.”
It would be nice if the players a team drafts do well and stay with the team, but it is also nice to acquire talent from other teams, and it is also nice to sign an undrafted free agent.
Hide additional Information regarding Talent Distribution
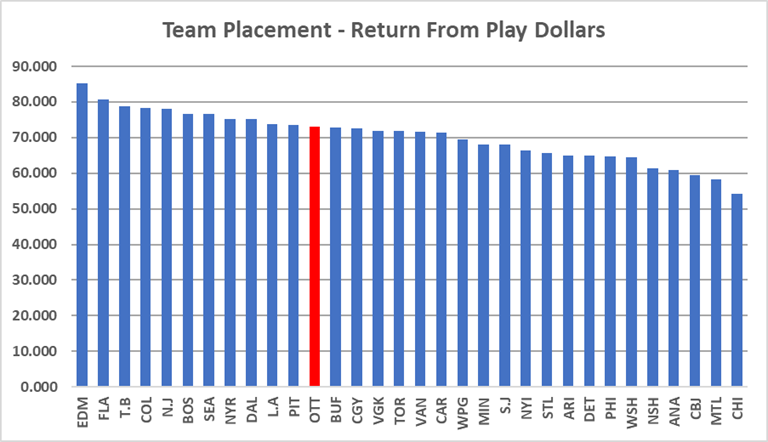
Return From Play Dollars
More information regarding Return From Play Dollars
Return From Play (RFP) translates a player’s Productivity Rating into a dollar amount that is loosely based on the 2021-22 salary cap. It has nothing to do with how much a player was paid: it is about how much a player was worth.
We do this sort of thing all the time. “They charged me $10 for the hamburger, but it tasted like a $30 steak.” “I bought my used car for $10,000, but it rides like a $50,000 car.” “I paid $500 a night for a hotel in Toronto; the place might have been worth $200.”
In 2022-23, Zach Hyman (EDM) was in the PR-Star category and had a PR-Score of 8.6554. His RFP was $7,040,000, based on his PR-Score. Essentially, he played like a $7-million player.
Seasonal RFPs can be added together, producing a total RFP for a player over time. Auston Matthew’s (TOR) return from play in his career is $55,920,000.
The RFP of all players on a team can be added together, telling us something about the level of talent on it. Colorado’s RFP in 2022-23 was $78,340,000, while the RFP of Columbus was $59,455,000. Colorado had the better players.
Hide additional Information regarding Return From Play Dollars
Lines and Pairs
More information regarding Lines & Pairs
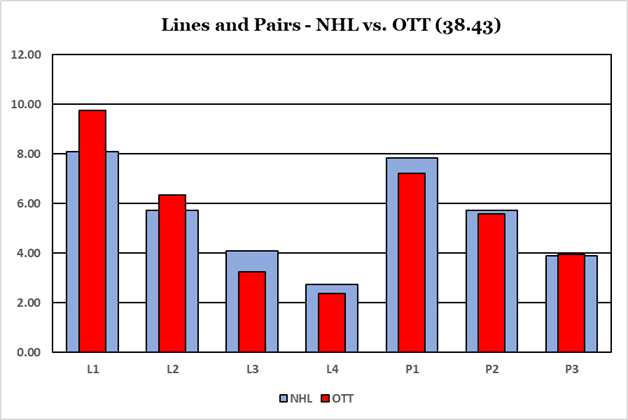
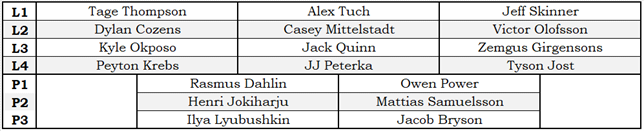
The Lines and Pairs section consists of the chart above and the table below. The chart shows where the team’s talents are in comparison to the league average, while the table shows which players are on which forward line or which defensive pair.
Players are sorted by team, by position and by their PR-Score. Traded players will use have their PR-Score apportioned based on how many games they played with each team. A player who played 50 games with one team and 25 games with a second team will be assigned 2/3 of his PR-Score for the team he played 50 games for, and 1/3 of his PR-Score for the team he played 25 games for.
The top three forwards are identified as the first line, the next three as the second line, and so on. There is no guarantee that any line has actually played even one second together during the season: the lines and pairs are solely based on productivity rating.
There are times when a player who was traded at the trade deadline will appear on the L&P table for both teams he played for. That just means that he was one of the top twelve forwards (or top six defensemen) for both teams, based on the statistics he accumulated with each team.
Hide Information regarding Lines & Pairs
Team Leaders – Stapled To The Bench Categories
More information regarding Team Leaders – Stapled To The Bench Categories
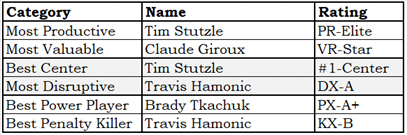
The Team Leader table identifies the best player on the team in six Stapled To The Bench categories. I will not go into the formulas used.
- The Most Productive player is the player with the highest PR-Score.
- The Most Valuable player is the player with the highest VR-Score.
- The Best Center is the player who was their team’s most highly rated center.
- The Most Disruptive player is based on blocked shots, hits and take-aways.
- The Best Power Player is based on both individual and team statistics that comes from powerplay time-on-ice.
- The Best Penalty Killer is based on statistics that comes from short-handed time-on-ice.
Hide additional Information regarding Team Leaders – Stapled To The Bench Categories
Team Leaders – On-Ice Situations
More information regarding Team Leaders – On-Ice Situations
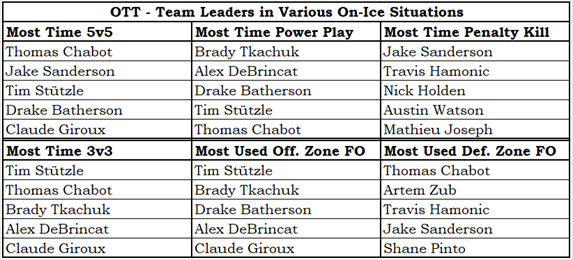
- The Team Leaders for various On-Ice situations table shows the players who got the most ice-time in certain situations.
- In the time categories, players are ranked by ice-time (in minutes played) over the season, not on ice-time per game played.
- A player who is normally heavily used in a certain situation but who missed a non-trivial number of games could fall out of the top five for his team.
- The two non-time categories show players ranked by the percent of their shifts that started in offensive or defensive zones.
- While I normally prefer to use actual counts, it seemed correct for these two categories to use percentages, provided they played a minimum number of minutes during the season.
- A minimum-time criteria avoids avoid identifying a player who played one or two games during the season as being one of the most heavily used offensive zone or defensive zone players.
Hide Information regarding Team Leaders – On-Ice Situations
Team Essay #1 – Power Play Importance
Ottawa had a good powerplay, a fact which could not really be doubted when you examine the data and a fact which was mentioned about seven times per game on the radio broadcasts. While Ottawa’s powerplay wasn’t the best in the league, it was more important to Ottawa than any other team’s powerplay was important to them.
I measure a team’s power play using PPGF60: Power Play Goals For Per 60 Minutes. PPGF60 is very comparable to powerplay percentage: a team that is good in one is good in the other; a team that is bad in one is bad in the other. Ottawa was 8th in the league in PPGF60, scoring 8.58 goals per 60 minutes of powerplay time. Edmonton was way out in front at 13.23, while the rest of the podium was occupied by Tampa Bay (9.62) and Los Angeles (9.56).
Why was Ottawa’s powerplay more important to them than it was to Edmonton or Tampa Bay or Toronto, teams that had a better PPGF60? It is because of their season record in games they scored power-play goals.
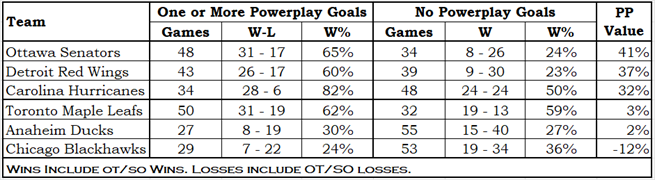
Ottawa was 31-17 when they scored a powerplay goal in a game, and 8-26 when they didn’t. The difference between those two winning percentages is 41%, the biggest in the league.
To give a little context, Boston was a league-leading 42-6 (88%) when scoring a powerplay goal and Carolina was second. Boston was 33-4 (89%) when scoring more powerplay goals than their opponents, also leading the league.
Chicago had the worst record in the league when scoring a powerplay goal (7-22, 24%). They were the only team in the NHL that had a better record when they didn’t score a powerplay goal (19-34, 36%). If anybody understands the Chicago conundrum, please publish your analysis.
Team Essay #2 – Third Line Woes
When I heard an announcer on the Team 1200 (Ottawa’s best radio station) say that Ottawa’s first and second line were among the best in the league, I admit I snorted. It came across, to me, as boosterism, or as a large exaggeration. The top six were better than some, as Stutzle and Giroux were having good years, but among the best? I thought, “You can fool most of the fans, but you can’t fool me. I can check the facts.”
So I ran the numbers, as a formality, and to my surprise the announcer was correct: Ottawa’s top six forwards are the third best in the league, behind only Tampa Bay and Edmonton.
In Ottawa it is the third and fourth lines that are the issue, and to a lesser extent it is the defensemen that are the issue. While their top two lines are almost second-to-none, their bottom to lines are second-to-all: they are 32nd out of 32 teams. As a group, Ottawa’s top six defensemen rank 21st in the league in total PR-Score. A little health would go a long way to improving that ranking, as individual player PR-Scores increase when they play more.
Ottawa has no hope of making the playoffs unless they significantly improve their third and fourth lines. It may not need six new players, but if probably needs at least four new ones.