
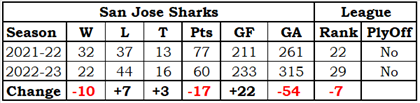
Standings
Team Record by Game Type
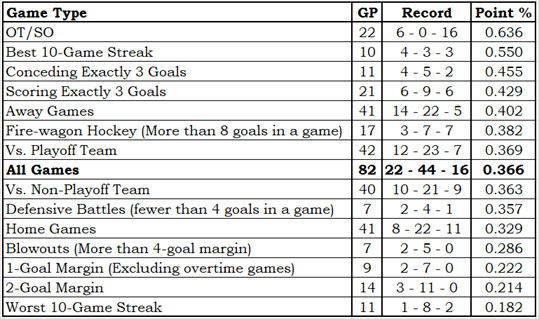
More information regarding Team Record by Game Type
The Team Record by Game Type is based on an idea I saw in a Bill James Baseball Abstract (exact year unknown; it was in an Abstract from the 1980s). It showed how a specific team did in various types of games, and it is exactly the sort of thing that I really like.
The table is sorted by point percentage (Point % column), so each team’s content order will be different and logically related game types could be well separated. Since that is the way that Bill James did it, it must be the correct way.
OT/SO is a team’s record in overtime and shootout games. These games are impossible to lose, so the loss count will always be zero. A loss is a game in which a team gets no standing points; a tie is a game in which a team gets one standing point, as they do in overtime or shootout losses.
Conceding Exactly 3 Goals and Scoring Exactly 3 Goals show how teams did in games where they scored enough to have a chance to win or conceded just enough that they could win.
1-Goal Margin, 2-Goal Margin and Blowouts (More than 4-goal margin) are for games with scores like 6-5, 6-4 and 6-1 (respectively). The 1-goal games do not include OT/SO games.
Defensive Battles and Fire-wagon Hockey are for games with scores like 2-0 and 7-3 (respectively). The entire set of Defensive Battle scores are 3-0, 2-1, 2-0 and 1-0.
Vs. Playoff Team and Vs. Non-Playoff Team are based on opponent playoff status at the end of the season, not at the time of the game. Two examples: Pittsburgh would be a non-playoff opponent and Florida would be a playoff opponent.
Best 10-Game Streak and Worst 10-Game Streak need no further explanation.
Home Games, Away Games and All Games need no further explanation.
Hide additional Information regarding Team Record by Game Type
Talent Distribution
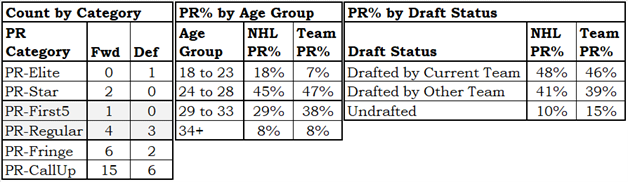
More information regarding Talent Distribution
The Talent Distribution tables show how player talent is distributed in a team.
The Count by Category table shows how many players the team has in each of the six PR Categories, broken down by position. It is good to have PR-Elite and PR-Star players.
The PR% by Age Group table shows where the team’s productivity lies by age group. For context, it also shows the league averages.
If a team has a lot of talent in the younger age groups you would think that was a good omen for the team’s future, while if the team has a lot of talent in the older age groups that would seem to be a bad omen: old players don’t get better, they get worse.
The PR% by Draft Status shows how a team acquired the talent they have, by one of three categories: they drafted the player, another team drafted the player, or the player was undrafted. In order to provide a little context, league averages are also shown.
This information is more “how a team got their talent” than “how a team should get its talent.”
It would be nice if the players a team drafts do well and stay with the team, but it is also nice to acquire talent from other teams, and it is also nice to sign an undrafted free agent.
Hide additional Information regarding Talent Distribution
Return From Play Dollars
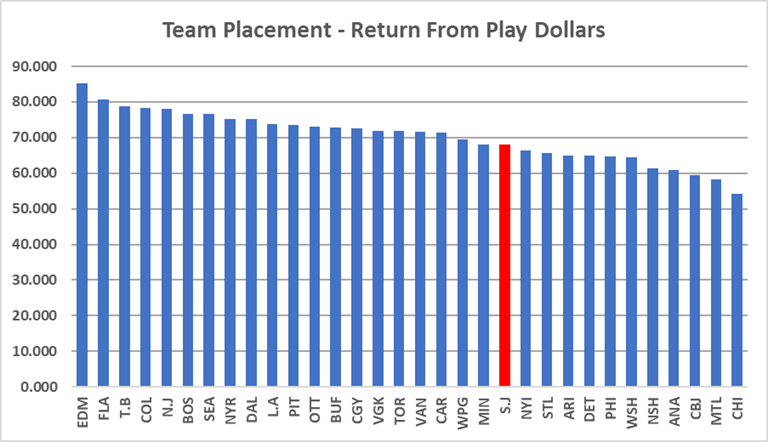
More information regarding Return From Play Dollars
Return From Play (RFP) translates a player’s Productivity Rating into a dollar amount that is loosely based on the 2021-22 salary cap. It has nothing to do with how much a player was paid: it is about how much a player was worth.
We do this sort of thing all the time. “They charged me $10 for the hamburger, but it tasted like a $30 steak.” “I bought my used car for $10,000, but it rides like a $50,000 car.” “I paid $500 a night for a hotel in Toronto; the place might have been worth $200.”
In 2022-23, Zach Hyman (EDM) was in the PR-Star category and had a PR-Score of 8.6554. His RFP was $7,040,000, based on his PR-Score. Essentially, he played like a $7-million player.
Seasonal RFPs can be added together, producing a total RFP for a player over time. Auston Matthew’s (TOR) return from play in his career is $55,920,000.
The RFP of all players on a team can be added together, telling us something about the level of talent on it. Colorado’s RFP in 2022-23 was $78,340,000, while the RFP of Columbus was $59,455,000. Colorado had the better players.
Hide additional Information regarding Return From Play Dollars
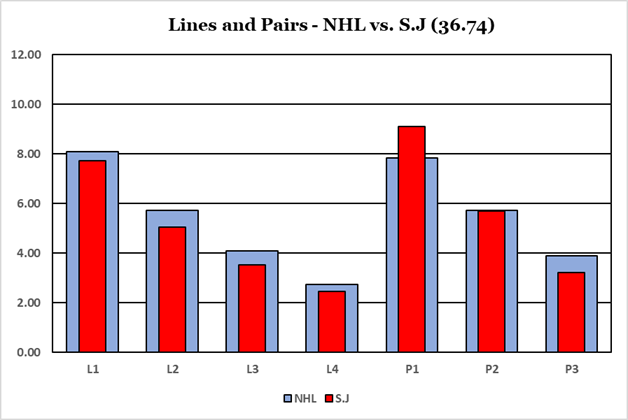
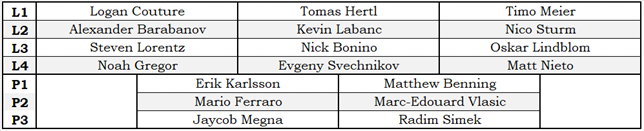
Lines and Pairs
More information regarding Lines & Pairs
The Lines and Pairs section consists of the chart above and the table below. The chart shows where the team’s talents are in comparison to the league average, while the table shows which players are on which forward line or which defensive pair.
Players are sorted by team, by position and by their PR-Score. Traded players will use have their PR-Score apportioned based on how many games they played with each team. A player who played 50 games with one team and 25 games with a second team will be assigned 2/3 of his PR-Score for the team he played 50 games for, and 1/3 of his PR-Score for the team he played 25 games for.
The top three forwards are identified as the first line, the next three as the second line, and so on. There is no guarantee that any line has actually played even one second together during the season: the lines and pairs are solely based on productivity rating.
There are times when a player who was traded at the trade deadline will appear on the L&P table for both teams he played for. That just means that he was one of the top twelve forwards (or top six defensemen) for both teams, based on the statistics he accumulated with each team.
Hide Information regarding Lines & Pairs
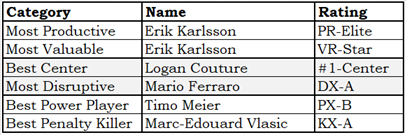
Team Leaders – Stapled To The Bench Categories
More information regarding Team Leaders – Stapled To The Bench Categories
The Team Leader table identifies the best player on the team in six Stapled To The Bench categories. I will not go into the formulas used.
- The Most Productive player is the player with the highest PR-Score.
- The Most Valuable player is the player with the highest VR-Score.
- The Best Center is the player who was their team’s most highly rated center.
- The Most Disruptive player is based on blocked shots, hits and take-aways.
- The Best Power Player is based on both individual and team statistics that comes from powerplay time-on-ice.
- The Best Penalty Killer is based on statistics that comes from short-handed time-on-ice.
Hide additional Information regarding Team Leaders – Stapled To The Bench Categories
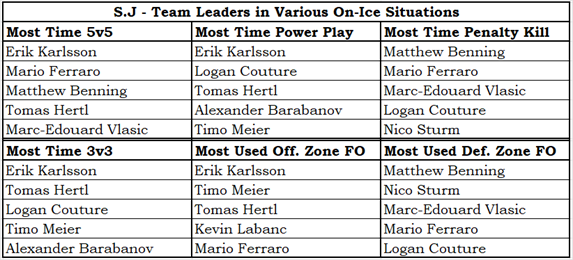
Team Leaders – On-Ice Situations
More information regarding Team Leaders – On-Ice Situations
- The Team Leaders for various On-Ice situations table shows the players who got the most ice-time in certain situations.
- In the time categories, players are ranked by ice-time (in minutes played) over the season, not on ice-time per game played.
- A player who is normally heavily used in a certain situation but who missed a non-trivial number of games could fall out of the top five for his team.
- The two non-time categories show players ranked by the percent of their shifts that started in offensive or defensive zones.
- While I normally prefer to use actual counts, it seemed correct for these two categories to use percentages, provided they played a minimum number of minutes during the season.
- A minimum-time criteria avoids avoid identifying a player who played one or two games during the season as being one of the most heavily used offensive zone or defensive zone players.
Hide Information regarding Team Leaders – On-Ice Situations
Team Essay #1 – Rebound Season
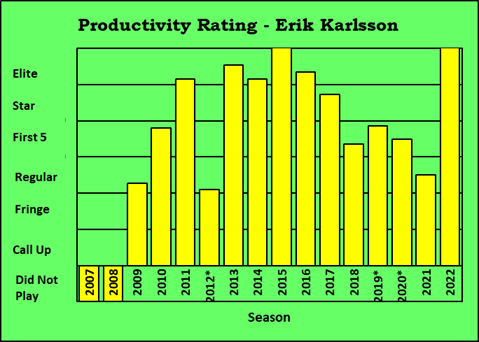
I was surprised that Erik Karlsson was rated as a VR-Star in 2022-23. I would have sworn he would have been VR-Elite. My mental picture of Erik Karlsson is the 2013-14 to 2016-17 version: four consecutive PR-Elite seasons. When he left Ottawa to ply his trade in San Jose, he fell off my radar: I am not staying up until two in the morning to watch San Jose play.
In his Career Productivity Rating chart, you’ll see he declined starting in 2016-17. Until 2022-23, the last time he had a “good-for-him” season was 2015-16. A “good-for-him” season means his PR-Score was greater than his VR-Score: in his Carrer Value Rating chart you will see that his VR-Score has been higher than his PR-Score since 2016-17.
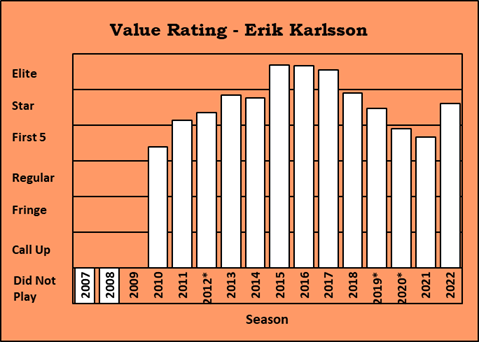
The dip in productivity was a combination of missing games and not playing like Erik Karlsson when he did play. He missed 29 games in 2018-19, 32 games in 2021-22. The VR calculations make a partial adjustment for missed games, so the descent in VR-Scores over the years is more a sign of bad play than bad attendance.
I’m guessing that Karlsson was as healthy in 2022-23 as he has ever been. He played all 82 games, which he hadn’t done since 2015-16. He played 26 minutes per game, the most ice time he has had since 2018-19.
While he got 27 points while on the power-play, there were nine other defensemen who had more power-play points, and two others who had the same. At even strength, Karlsson smashed the rest of the defensemen for scoring. He had 74 points while Vince Dunn of Seattle was in second place at 49 points.
I have a very soft spot in my heart for Karlsson. I almost saw him being drafted by the Senators. My wife, my son and I were at the draft in Ottawa. The only problem was that I had had a gall bladder operation two days before the draft, and I was in a little pain. As the draft went on, I got more and more uncomfortable. Ottawa had the 18th pick and I knew I needed my pain-killing medication before they’d make their pick. Just after the 13th pick, I said we should head home and watch the draft on TV. We got in the car, turned on TSN 1200 radio, and heard Gary Bettman announce “we have a trade.” Ottawa made their pick as we were driving home, so we heard it on the radio. So close, yet so far.
I greatly enjoyed his renaissance. It would be foolish to expect him to have another PR-Elite season in 2023-24, but one can always hope.
Team Essay #2 – Breakdown Records
The Sharks breakdowns were particularly unusual.
They were better on the road than at home.
Their worst ten game streak and their best ten game streak were separated by only seven points (four points for the worst, eleven points in their best).
They were very slightly better against playoff teams than against non-playoff teams.
They were below their team average (points percentage of 0.366) in one-goal games, two-goal games and blowouts, which are five-plus goal games (scores like 6-1 or 8-0). This means they were better than their average in games which had three-goal or four-goal margins.
They were below their team average in both defensive struggles and blowouts.
Almost any one of those unusual breakdowns could be the subject of a team essay. But none of those breakdowns were as interesting as Erik Karlsson.