
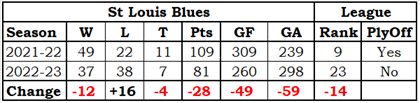
Standings
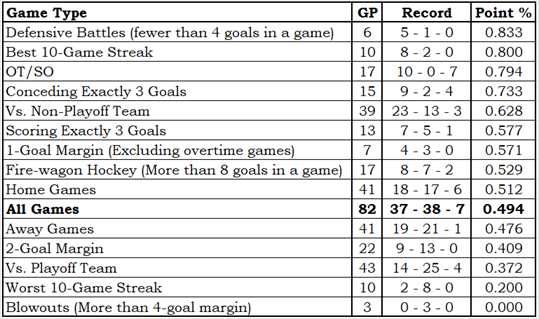
Team Record by Game Type
More information regarding Team Record by Game Type
The Team Record by Game Type is based on an idea I saw in a Bill James Baseball Abstract (exact year unknown; it was in an Abstract from the 1980s). It showed how a specific team did in various types of games, and it is exactly the sort of thing that I really like.
The table is sorted by point percentage (Point % column), so each team’s content order will be different and logically related game types could be well separated. Since that is the way that Bill James did it, it must be the correct way.
OT/SO is a team’s record in overtime and shootout games. These games are impossible to lose, so the loss count will always be zero. A loss is a game in which a team gets no standing points; a tie is a game in which a team gets one standing point, as they do in overtime or shootout losses.
Conceding Exactly 3 Goals and Scoring Exactly 3 Goals show how teams did in games where they scored enough to have a chance to win or conceded just enough that they could win.
1-Goal Margin, 2-Goal Margin and Blowouts (More than 4-goal margin) are for games with scores like 6-5, 6-4 and 6-1 (respectively). The 1-goal games do not include OT/SO games.
Defensive Battles and Fire-wagon Hockey are for games with scores like 2-0 and 7-3 (respectively). The entire set of Defensive Battle scores are 3-0, 2-1, 2-0 and 1-0.
Vs. Playoff Team and Vs. Non-Playoff Team are based on opponent playoff status at the end of the season, not at the time of the game. Two examples: Pittsburgh would be a non-playoff opponent and Florida would be a playoff opponent.
Best 10-Game Streak and Worst 10-Game Streak need no further explanation.
Home Games, Away Games and All Games need no further explanation.
Hide additional Information regarding Team Record by Game Type
Talent Distribution
More information regarding Talent Distribution
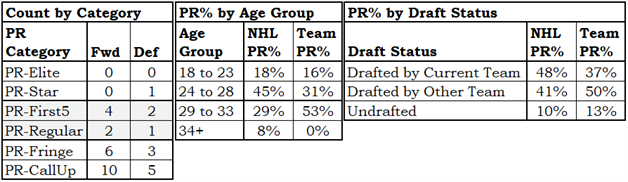
The Talent Distribution tables show how player talent is distributed in a team.
The Count by Category table shows how many players the team has in each of the six PR Categories, broken down by position. It is good to have PR-Elite and PR-Star players.
The PR% by Age Group table shows where the team’s productivity lies by age group. For context, it also shows the league averages.
If a team has a lot of talent in the younger age groups you would think that was a good omen for the team’s future, while if the team has a lot of talent in the older age groups that would seem to be a bad omen: old players don’t get better, they get worse.
The PR% by Draft Status shows how a team acquired the talent they have, by one of three categories: they drafted the player, another team drafted the player, or the player was undrafted. In order to provide a little context, league averages are also shown.
This information is more “how a team got their talent” than “how a team should get its talent.”
It would be nice if the players a team drafts do well and stay with the team, but it is also nice to acquire talent from other teams, and it is also nice to sign an undrafted free agent.
Hide additional Information regarding Talent Distribution
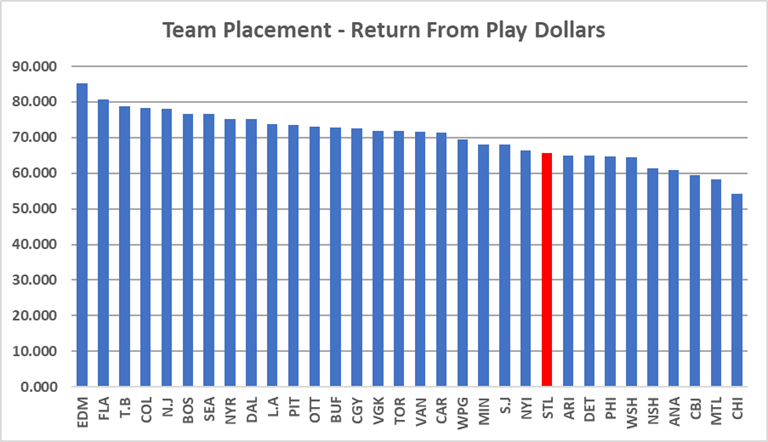
Return From Play Dollars
More information regarding Return From Play Dollars
Return From Play (RFP) translates a player’s Productivity Rating into a dollar amount that is loosely based on the 2021-22 salary cap. It has nothing to do with how much a player was paid: it is about how much a player was worth.
We do this sort of thing all the time. “They charged me $10 for the hamburger, but it tasted like a $30 steak.” “I bought my used car for $10,000, but it rides like a $50,000 car.” “I paid $500 a night for a hotel in Toronto; the place might have been worth $200.”
In 2022-23, Zach Hyman (EDM) was in the PR-Star category and had a PR-Score of 8.6554. His RFP was $7,040,000, based on his PR-Score. Essentially, he played like a $7-million player.
Seasonal RFPs can be added together, producing a total RFP for a player over time. Auston Matthew’s (TOR) return from play in his career is $55,920,000.
The RFP of all players on a team can be added together, telling us something about the level of talent on it. Colorado’s RFP in 2022-23 was $78,340,000, while the RFP of Columbus was $59,455,000. Colorado had the better players.
Hide additional Information regarding Return From Play Dollars
Lines and Pairs
More information regarding Lines & Pairs
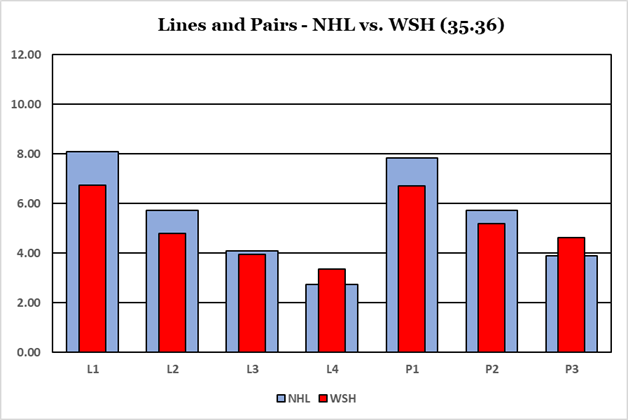
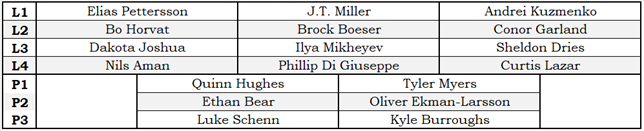
The Lines and Pairs section consists of the chart above and the table below. The chart shows where the team’s talents are in comparison to the league average, while the table shows which players are on which forward line or which defensive pair.
Players are sorted by team, by position and by their PR-Score. Traded players will use have their PR-Score apportioned based on how many games they played with each team. A player who played 50 games with one team and 25 games with a second team will be assigned 2/3 of his PR-Score for the team he played 50 games for, and 1/3 of his PR-Score for the team he played 25 games for.
The top three forwards are identified as the first line, the next three as the second line, and so on. There is no guarantee that any line has actually played even one second together during the season: the lines and pairs are solely based on productivity rating.
There are times when a player who was traded at the trade deadline will appear on the L&P table for both teams he played for. That just means that he was one of the top twelve forwards (or top six defensemen) for both teams, based on the statistics he accumulated with each team.
Hide Information regarding Lines & Pairs
Team Leaders – Stapled To The Bench Categories
More information regarding Team Leaders – Stapled To The Bench Categories
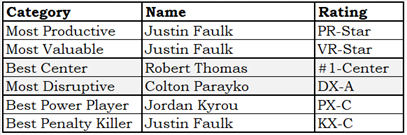
The Team Leader table identifies the best player on the team in six Stapled To The Bench categories. I will not go into the formulas used.
- The Most Productive player is the player with the highest PR-Score.
- The Most Valuable player is the player with the highest VR-Score.
- The Best Center is the player who was their team’s most highly rated center.
- The Most Disruptive player is based on blocked shots, hits and take-aways.
- The Best Power Player is based on both individual and team statistics that comes from powerplay time-on-ice.
- The Best Penalty Killer is based on statistics that comes from short-handed time-on-ice.
Hide additional Information regarding Team Leaders – Stapled To The Bench Categories
Team Leaders – On-Ice Situations
More information regarding Team Leaders – On-Ice Situations
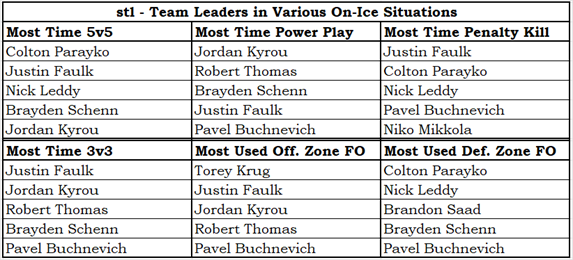
- The Team Leaders for various On-Ice situations table shows the players who got the most ice-time in certain situations.
- In the time categories, players are ranked by ice-time (in minutes played) over the season, not on ice-time per game played.
- A player who is normally heavily used in a certain situation but who missed a non-trivial number of games could fall out of the top five for his team.
- The two non-time categories show players ranked by the percent of their shifts that started in offensive or defensive zones.
- While I normally prefer to use actual counts, it seemed correct for these two categories to use percentages, provided they played a minimum number of minutes during the season.
- A minimum-time criteria avoids avoid identifying a player who played one or two games during the season as being one of the most heavily used offensive zone or defensive zone players.
Hide Information regarding Team Leaders – On-Ice Situations
Team Essay – Random Thoughts on Special Teams
While St. Louis didn’t have the worst special teams in the league, they are in the bottom six and they are the lowest of the teams who’s review I am yet to write.
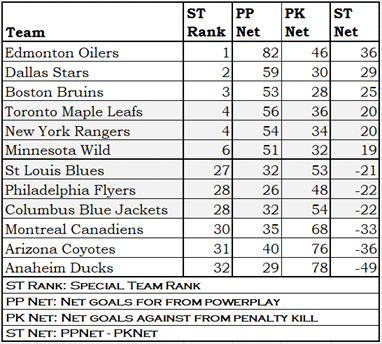
I ranked the teams based on their net goals from special teams play. Special Teams Net Goals (STNet) is calculated by taking a powerplay goals scored, subtracting the shorthanded goals they have conceded, subtracting the goals they allowed while killing penalties and adding the goals they scored while killing penalties. St. Louis scored 46 powerplay goals, allowed 14 shorties, gave up 60 goals while killing penalties and scored 7 shorties: for them, STNet = 46 – 14 – 60 +7 = -21.
The following table shows the six best and six worst STNet teams. Anaheim stands out for all the wrong reasons.
Another way to measure penalty killing prowess is PKGA60: penalty-kill goals allowed per 60 minutes. The league average for PKGA60 is 7.7; St. Louis was 30th in the league at 10.2. For every hour they were shorthanded, they gave up 2.5 more goals than average and 5.7 more than league-best Boston (PKGA60=4.5).
While I don’t want to lay blame at the foot of any set of players, it looks like part of Blues’ blues with killing penalties belongs to their goalies. St. Louis gave up 60 goals while killing penalties, but their expected goals against was 49.5. I see no other way of interpreting these data than to infer that their goalies gave up 10 goals “too many.”
St. Louis did what they could to minimize goals allowed while shorthanded: they were shorthanded the second-least in the league. Of course, another reason they had a low amount of shorthanded time is that a shorthanded situation usually ends when a power-play goal is conceded.
St. Louis didn’t miss the playoffs because of their special teams. Had they broken even on special team scoring they would have gotten six more points (using Pythagorean point estimator), and 87 points was well out of the playoff race.
Just For Fun
The worst ten-game streak for the Blues came in games 2 through 11. Their next ten games, games 12 through 21, was their best ten-game streak.