
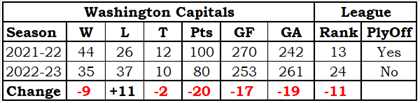
Standings
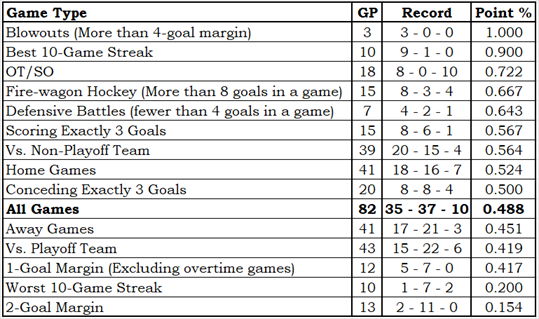
Team Record by Game Type
More information regarding Team Record by Game Type
The Team Record by Game Type is based on an idea I saw in a Bill James Baseball Abstract (exact year unknown; it was in an Abstract from the 1980s). It showed how a specific team did in various types of games, and it is exactly the sort of thing that I really like.
The table is sorted by point percentage (Point % column), so each team’s content order will be different and logically related game types could be well separated. Since that is the way that Bill James did it, it must be the correct way.
OT/SO is a team’s record in overtime and shootout games. These games are impossible to lose, so the loss count will always be zero. A loss is a game in which a team gets no standing points; a tie is a game in which a team gets one standing point, as they do in overtime or shootout losses.
Conceding Exactly 3 Goals and Scoring Exactly 3 Goals show how teams did in games where they scored enough to have a chance to win or conceded just enough that they could win.
1-Goal Margin, 2-Goal Margin and Blowouts (More than 4-goal margin) are for games with scores like 6-5, 6-4 and 6-1 (respectively). The 1-goal games do not include OT/SO games.
Defensive Battles and Fire-wagon Hockey are for games with scores like 2-0 and 7-3 (respectively). The entire set of Defensive Battle scores are 3-0, 2-1, 2-0 and 1-0.
Vs. Playoff Team and Vs. Non-Playoff Team are based on opponent playoff status at the end of the season, not at the time of the game. Two examples: Pittsburgh would be a non-playoff opponent and Florida would be a playoff opponent.
Best 10-Game Streak and Worst 10-Game Streak need no further explanation.
Home Games, Away Games and All Games need no further explanation.
Hide additional Information regarding Team Record by Game Type
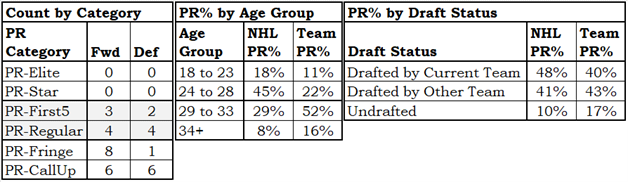
Talent Distribution
More information regarding Talent Distribution
The Talent Distribution tables show how player talent is distributed in a team.
The Count by Category table shows how many players the team has in each of the six PR Categories, broken down by position. It is good to have PR-Elite and PR-Star players.
The PR% by Age Group table shows where the team’s productivity lies by age group. For context, it also shows the league averages.
If a team has a lot of talent in the younger age groups you would think that was a good omen for the team’s future, while if the team has a lot of talent in the older age groups that would seem to be a bad omen: old players don’t get better, they get worse.
The PR% by Draft Status shows how a team acquired the talent they have, by one of three categories: they drafted the player, another team drafted the player, or the player was undrafted. In order to provide a little context, league averages are also shown.
This information is more “how a team got their talent” than “how a team should get its talent.”
It would be nice if the players a team drafts do well and stay with the team, but it is also nice to acquire talent from other teams, and it is also nice to sign an undrafted free agent.
Hide additional Information regarding Talent Distribution
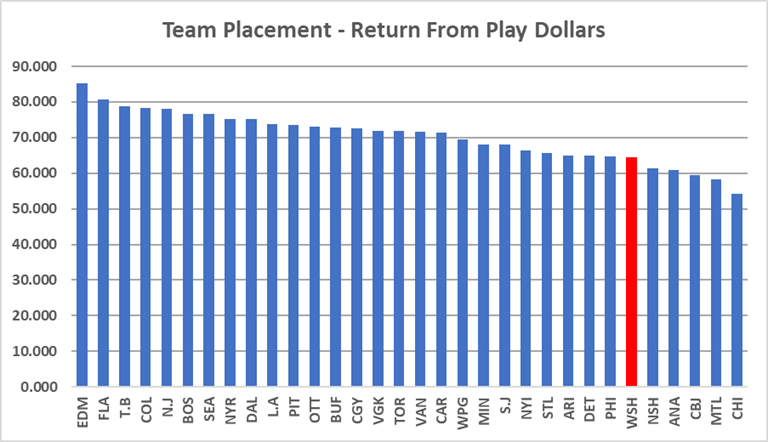
Return From Play Dollars
More information regarding Return From Play Dollars
Return From Play (RFP) translates a player’s Productivity Rating into a dollar amount that is loosely based on the 2021-22 salary cap. It has nothing to do with how much a player was paid: it is about how much a player was worth.
We do this sort of thing all the time. “They charged me $10 for the hamburger, but it tasted like a $30 steak.” “I bought my used car for $10,000, but it rides like a $50,000 car.” “I paid $500 a night for a hotel in Toronto; the place might have been worth $200.”
In 2022-23, Zach Hyman (EDM) was in the PR-Star category and had a PR-Score of 8.6554. His RFP was $7,040,000, based on his PR-Score. Essentially, he played like a $7-million player.
Seasonal RFPs can be added together, producing a total RFP for a player over time. Auston Matthew’s (TOR) return from play in his career is $55,920,000.
The RFP of all players on a team can be added together, telling us something about the level of talent on it. Colorado’s RFP in 2022-23 was $78,340,000, while the RFP of Columbus was $59,455,000. Colorado had the better players.
Hide additional Information regarding Return From Play Dollars
Lines and Pairs
More information regarding Lines & Pairs
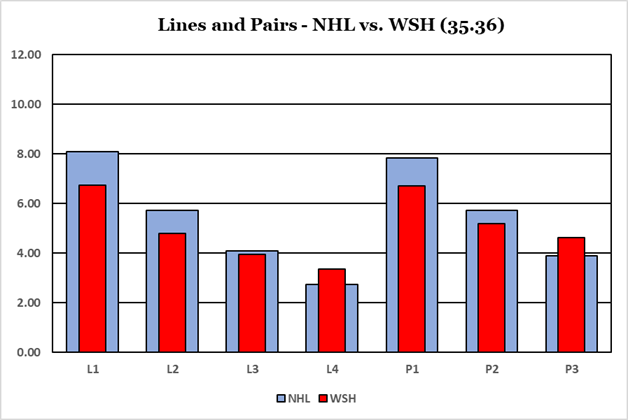
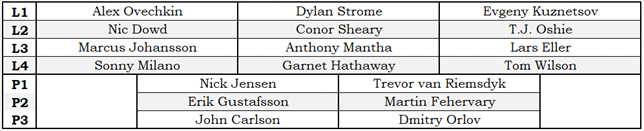
The Lines and Pairs section consists of the chart above and the table below. The chart shows where the team’s talents are in comparison to the league average, while the table shows which players are on which forward line or which defensive pair.
Players are sorted by team, by position and by their PR-Score. Traded players will use have their PR-Score apportioned based on how many games they played with each team. A player who played 50 games with one team and 25 games with a second team will be assigned 2/3 of his PR-Score for the team he played 50 games for, and 1/3 of his PR-Score for the team he played 25 games for.
The top three forwards are identified as the first line, the next three as the second line, and so on. There is no guarantee that any line has actually played even one second together during the season: the lines and pairs are solely based on productivity rating.
There are times when a player who was traded at the trade deadline will appear on the L&P table for both teams he played for. That just means that he was one of the top twelve forwards (or top six defensemen) for both teams, based on the statistics he accumulated with each team.
Hide Information regarding Lines & Pairs
Team Leaders – Stapled To The Bench Categories
More information regarding Team Leaders – Stapled To The Bench Categories
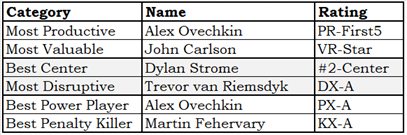
The Team Leader table identifies the best player on the team in six Stapled To The Bench categories. I will not go into the formulas used.
- The Most Productive player is the player with the highest PR-Score.
- The Most Valuable player is the player with the highest VR-Score.
- The Best Center is the player who was their team’s most highly rated center.
- The Most Disruptive player is based on blocked shots, hits and take-aways.
- The Best Power Player is based on both individual and team statistics that comes from powerplay time-on-ice.
- The Best Penalty Killer is based on statistics that comes from short-handed time-on-ice.
Hide additional Information regarding Team Leaders – Stapled To The Bench Categories
Team Leaders – On-Ice Situations
More information regarding Team Leaders – On-Ice Situations
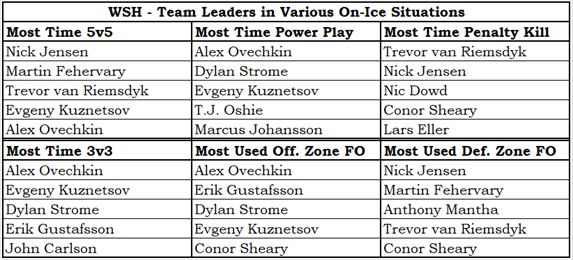
- The Team Leaders for various On-Ice situations table shows the players who got the most ice-time in certain situations.
- In the time categories, players are ranked by ice-time (in minutes played) over the season, not on ice-time per game played.
- A player who is normally heavily used in a certain situation but who missed a non-trivial number of games could fall out of the top five for his team.
- The two non-time categories show players ranked by the percent of their shifts that started in offensive or defensive zones.
- While I normally prefer to use actual counts, it seemed correct for these two categories to use percentages, provided they played a minimum number of minutes during the season.
- A minimum-time criteria avoids avoid identifying a player who played one or two games during the season as being one of the most heavily used offensive zone or defensive zone players.
Hide Information regarding Team Leaders – On-Ice Situations
Team Essay – Strong Start, Weak Finish
In their first 41 games, the Capitals were 22-13-6 and had a good shot of making the playoffs. After the games of January 5, 2023, Washington was tied for seventh in the league in terms of standing points.
Things did not go quite as well in their second half. After January 5th their record was 13-24-4, the second worst record in league. What in holy hockey sticks happened? Let’s start out with the view from 40,000 feet.
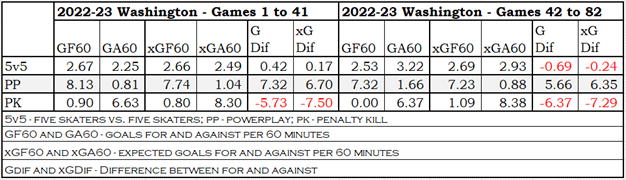
This table tells us quite a lot about the two halves of Washington’s season.
In the first half of the season, Washington’s results were slightly better than their play merited: they scored more goals than expected in all three manpower situations and gave up fewer goals than expected. They were playing at a 106-point pace for the season, based on the Pythagorean point-estimation formula.
The second half was a disaster. At 5v5 play, they went from outscoring their opponents by 0.41 goals per game to being outscored by 0.69 goals per game: that is a difference of 1.10 goals per game, which is a massive difference. Instead of playing at a 106-point pace, they played at a 69-point pace. They went from playing like a playoff team to playing like a team that is going to get a very good draft pick.
The second half’s downfall was largely on the defensive side. Expected goals against per 60 minutes went from 2.49 to 2.93 and actual goals against per 60 minutes went from 2.25 to 3.22. The Capitals were 0.24 goals against better than expectation in the first half, 0.29 goals against worse in the second half. I see this as worse play from their defensemen and from their goalies: the defencemen gave up more scoring chances, and the goalies gave up even more goals.
Let’s go up a level in detail and take a look at players, starting with defensemen.
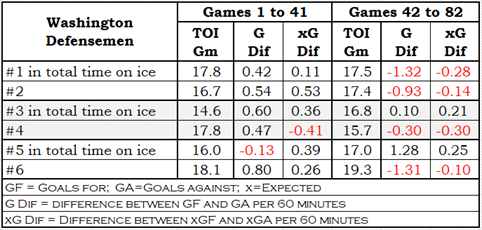
To simplify the display, I’m showing time on ice per game played, goal difference and expected goal difference for the six defensemen with the most time on ice in each half. A player can have data on two different lines: Nick Jensen is the #1 D in the first 41 games, but the #2 D in the second 41 games. As you will notice, player names are not displayed, as I wanted the chart to fit on a printed page when in portrait orientation. Time-on-ice per game goes up and down because players played different numbers of games.
The goal difference shows us what the players did while the expected goal difference shows us how effectively they played.
In the first half, the defensemen largely did well (GDif greater than zero) and played well (xGDif greater than zero). Also noticeable is a bit of fortunate play (GDif greater than xGDif).
The second half is, as we already know, a different story. They did not play well (xGDif below zero), they did not do well (GDif below zero), and they were unfortunate (xGDif less than GDif).
Two defensemen played much less in the second half: Erik Gustaffsson and John Carlson. Their minutes were taken up by Alexander Alexeyev and Rasmus Sandin (both of whom played better than Carlson did in the 10 games he played in the second half).
The nine most-used forwards in each half of the season have the same pattern. In the first half, eight had positive GDif values, eight had positive xGDif, and five had higher GDif than xGDif. In the second half, seven had negative GDif, six had negative xGDif and seven had their GDif value below their xGDif value.
There was a big turnover in the forwards who played the most minutes in each half, with only four players being in the top nine both times (Strome, Kuznetsov, Sheary, Ovechkin).
Washington used only two goalies all year, which I found astounding given I follow the Senators and am used to seeing a team use half a dozen goalies a year, if not more. Kuemper and Lindgren both played well in the first half, with Kuemper playing 58% of the time. Both had a goal against average that was lower than their expected goals against average, meaning they made a few good saves.
In the second half, Lindgren did not play nearly as well. Lindgren’s goals against average went from 2.57 to 3.80 (his expected goals against average splits were 2.78 and 3.02). This did not go unnoticed, as Kuemper got 73% of the ice time in the second half.
So, the second-half Capitals played worse than the first-half Capitals, and they weren’t as fortunate either. That’s a bad combination.
Perhaps a better question for the Capitals is what happened at the end of the first half of the season? They had a fifteen game streak where they went 12-1-2; the rest of the season they were 23-36-8. Aside from that fifteen game streak, they played at the same level as the Montreal Canadiens.