
Hope abouts at the start of a season. Every team, regardless its immediate history, has hope. “We’re coming off two great seasons, we’re sure to take the cup this time.” “We were so unlucky these last two seasons. The luck is bound to change now.” “We’ve been struggling for years, but we made some great acquisitions. We’re sure to make the playoffs this year.”
After 82 games there will be elation and desolation, delight and despair. To be honest, the desolation and despair usually doesn’t need a full 82 games to manifest themselves. Teams that are going to be disappointing almost always start the season poorly.
I wondered whether a formula could be developed that would establish what the expectations for a team should be, based solely on their immediate standings history. As I will be using just standings data, I will be ignoring all of the things that happen in the off-season that could impact team expectations: retirements, signings, trades, drafts. And there are unpredictable events that happen during a season that will impact team performances: injuries and sub-par play are the two down-forces, while unexpected improvement in a player is an up-force.
Needless to say, I did not expect a perfect formula. I was hoping for one that was adequate.
Broad Strokes
I looked at a points-prediction formula that involved the previous two seasons and an average season, based on work done by Bill James for baseball. Including an average season recognizes that, over time, teams tend to “regress to the mean.” In non-mathematical terms, teams tend to move towards the middle: bad teams improve, good teams decline (usually).
As the player-level data Stapled To The Bench uses goes back to the 2007/2008 season, I decided to use the standing data from only those seasons only in this research. It’s a small set of data that was impacted by one lockout and two pandemics (or one pandemic, twice).
To simplify my work as much as possible, I converted the points gained in shortened seasons to their equivalent in an 82-game schedule. As an example, Anaheim in 2019 had 67 points in 71 games played, which is the equivalent of 77 points in an 82-game season.
Points-Based Expectation (PBX)
The formula for predicting points in a season is:

In the formula, ‘Pts’ means standing points, ‘Wt’ means weight, ‘2’ means two seasons ago, ‘1’ means last season and ‘A’ means average. This is the Bill James formula for predicting winning percentage in a season.
The fun part of developing the formula was determining the weights. I started with a set of weights and then compared the total difference between predicted points and actual points for all teams. I’d then change a weight, and if the total difference dropped, I knew I was getting warmer.
I started with Wt1=3, Wt2=2 and WtA=1. After some experimentation, I ended up with Wt1=9, Wt2=5 and WtA=10. It didn’t really take as much effort as you might think. It quickly became apparent that 2-1-2 was the best fit for low weights (weights less than four). I then multiplied the weights be five (10-5-10) and experimented a little more.
The difference between 2-1-2 and 9-5-10 is really tiny: 2-1-2 had 211 predictions that were within 0-8 points from the actual result and had an average difference of 10.02; 9-5-10 had 212 predictions that were 0-8 points from the actual result and had an average difference of 10.01.
9-5-10 had one more prediction that was within 8 points of actual and its average difference was 0.01 better. Why use 9-5-10 when it’s almost the same as 2-1-2? Because it’s more accurate, that’s why.
Detailed Exampled Using Minnesota 2018/2019
In 2017 and 2016 respectively, Minnesota had 101 and 106 points. Putting those numbers into the formula gives us:

That works out to 98 points (rounded to the nearest whole number). They ended up with 83 points, 15 fewer than the points-based-expectation.
Detailed Exampled Using Pittsburgh 2018/2019
In 2017 and 2016 respectively, the Penguins had 100 and 111 points. Putting those numbers into the formula gives us:

That works out to 99 points (rounded to the nearest whole number). They ended up with 100 points, 1 more than the points-based-expectation.
53% of the time, the prediction is accurate 100% of the time.
Points Based Expectation For 2022/2023 Season
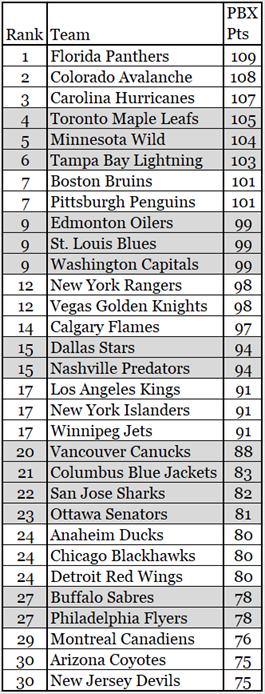
To the left are the points-based expectations for all teams but Seattle. Seattle, having played only one season, did not have enough data for the prediction process.
A small word about the row shading: I normally shade in a specific pattern (x rows shaded followed by x rows unshaded). I did not do that here because I wanted teams with the same prediction to have the same shading, such as the Kings, the Islanders and the Jets.
Just over half the teams should be within four wins of their prediction. Nashville’s prediction range is 102 to 86: this ranges from safely in the playoffs to nowhere near the playoffs.
Teams that made changes in the off-season are least likely to be within their expectation range.
Chicago is jettisoning players like a belt-fed mortar: 80 points is a level they may not achieve in several seasons.
The fans of the Ottawa Senators are expecting well more than 81 points: they want them to be in the low to mid 90-point range, a playoff contender. With all of the improvements they made in the off-season, what else could you expect?
Ottawa made some nice trades and signings. Chicago “positioned themselves for a total rebuild.”
Summary
As mentioned early on, the PBX process doesn’t allow for the things that happen during the off-season. This includes, but is not limited to: retirements, signings and trades. As it is a prediction, it obviously doesn’t specifically allow for in-season injuries and player improvements or degradations.
I’m a numbers guy, so I think an interesting pool would be a standing points prediction pool. A participant predicts the final standing points of all 32 teams, and loses one point for each standing point difference they are on each team. Closest to zero wins the pool.