
In a year where one player scored 69 goals and two players had 100 assists, the Best Player Plaque went to some other fella? Somebody better explain that, and that somebody is me.
Generally, How is the Best Player Determined?
At Stapled to the Bench (STTB), the best player is determined mathematically. Select statistics from a season of play are churned through a formula, producing PR-Scores that metaphorically separate the wheat from the chaff. Literally, PR-Scores separate the Elite from the All-Stars from the Regulars from the Call-Ups.
Play in the playoffs has zero impact on this award. Play in earlier seasons has zero impact on this award. What players might do in future seasons has zero impact on this award. Personal opinions, whether yours or mine, have zero impact on this award.
More than a dozen NHL statistics are used in the PR-Score formulas, culled from the hundreds of statistics that are freely available. My source for statistics is the excellent website NaturalStatTrick.com.
Count Statistics
PR-Scores are based on counts, not rates. Shane Pinto (OTT) played 41 games and scored 9 goals: his PR-Score is based on the 9 goals he scored, not on the 18 goals he was on pace to score had he played all 82 games.
Using rate statistics (18 goals per 82 games) is a huge problem given the number of players that play one game and get lucky. For example, Luca Del Bel Belluz (CBJ) scored in his only game played this season, putting him on pace for 82 goals.
Another problem with using rate statistics is that it whitewashes over the fact that players miss games. Not playing cannot be seen as an advantage: this isn’t the NBA. If you were to ask me whether Mitchell Marner (TOR) would have had a better rating had he played all 82 games, I would tell you that it looks like we agree that his PR-Score is correct, as he didn’t get the statistics he would have gotten had he played those extra games.
Specifically, How is the Best Player Determined?
I will take you through the PR-Score calculations for the top four players in 2023-24.
You’ve got Auston Matthews (TOR), your 69-goal scorer. You’ve got your 100-assist men, Nikita Kucherov (T.B) and Connor McDavid (EDM). And you’ve got the Best Player, Nathan MacKinnon (COL).
PR-Points: Time-On-Ice
Time-On-Ice (TOI) is included in the PR-Score calculations because better players play more than lesser players and better defensive players play on the penalty kill.
Aside: there are not a lot of good statistics that describe a player’s defensive abilities, and I will concede that the PR-Score process may well undervalue defensive players.
Time-On-Ice from all strengths of play (5v5, 5v4, right down to 3v3) generates 0.0012 PR-Points per minute. A bonus of 0.0009 points per minute is given for all minutes played above 1,230 in a season (1,230 minutes is 15 minutes per game over 82 games).
PenaltyKill Time-On-Ice generates 0.0030 PR-Points per minute.
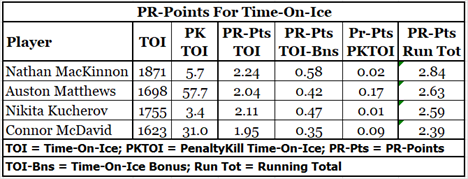
MacKinnon got a lot of ice time.
I do not worry about why the statistics are what they are. Should MacKinnon’s TOI data be discounted because 370 of them came on the powerplay? No, that should not result in a discount, as that was an important role he filled for the Avalanche. And it’s not like the other three players sat on the bench during powerplays.
PR-Points: Scoring
Obviously, scoring is important in hockey. Players get 0.0800 PR-Points from each goal they score and 0.0500 PR-Points from each assist they get.
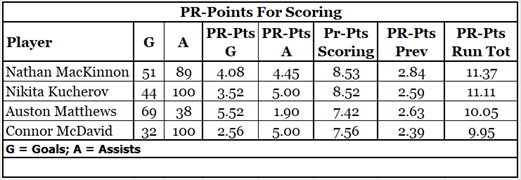
MacKinnon didn’t score 69 goals and he didn’t get 100 assists, yet he got the most PR-Points for scoring (8.53). Matthews, in spite of his 69 goals, had the least PR-Points from scoring in this group. Let’s do some one-on-one comparisons to clarify the situation.
MacKinnon had 7 more goals than Kucherov, giving him 0.56 more PR-Points. He had 11 assists fewer, costing him 0.55 PR-Points. In total, MacKinnon had 0.01 more PR-Points from scoring than did Kucherov.
Matthews had 18 more goals than MacKinnon, giving him 1.44 more PR-Points. But he had 51 fewer assists, costing him 2.55 PR-Points. Because of scoring, Matthews actually fell 1.11 PR-Points further behind MacKinnon.
Several aspects of Productivity Rating’s design are at play here.
One: The only thing that matters is what happened this season. It doesn’t matter that Matthews had more goals than any player in decades. He got credit for 69 goals because he scored 69 goals.
Two: PR-Points are not affected by lines in the sand. Had Matthews scored his 70th goal, he would have earned another 0.0800 PR-Points because each goal is worth 0.0800, whether it is the first goal of the season, or the 17th, or the 70th. There are no bonuses for scoring 40, 50, or 60 goals.
Three: Goals are more valuable than assists (0.08, 0.05), but assists aren’t valueless. Matthews had a good advantage over the other players in terms of goals, but he was swamped by the others in terms of assists.
The vast majority of PR-Points for the top players in the league come from Time-on-ice, goals, and assists. The big categories have been dealt with, and the rest of the categories are icing on the cake.
PR-Points: Faceoffs
Faceoff data is used in the Productivity Rating formulas, but STTB does not use the familiar “faceoff winning percentage” data. It credits players with 0.0002 PR-Points for each faceoff taken, and 0.0003 PR-Points for each faceoff won.
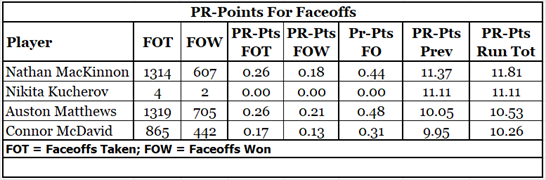
For those readers who think faceoff winning percentage is important, consider what would have happened had Kucherov won three of his four faceoffs: his faceoff winning percentage would have been 75%, which is way more than any of the other players (Matthews is the best of this group at 53%). The second you say that an allowance has to be made for players who only took a few faceoffs you admit that the count of faceoff data is more important than the rate of faceoff data. 442 faceoff wins are worth more than 2 faceoff wins.
For the readers who think that STTB has undervalued faceoffs, let me assure you that I haven’t. We can all remember a game where our favourite center won a faceoff late in the game that led to a goal that won the game for our favourite team. That might happen two or three times a year, STTB uses season-level data, not just data from a game in January.
PR-Points: Blocks, Takeaways and Giveaways
Two statistics that describe defensive activity are blocked shots and takeaways. I wanted as many useful defensive statistics as possible, so they obviously should be included. And it would be improper to include takeaways but ignore giveaways, as they are basically two sides of the same coin.
Players get 0.0040 PR-Points for each blocked shot and 0.0050 for each takeaway. As a giveaway is the opposite of a takeaway, a player loses 0.0050 PR-Points for each giveaway. A bonus category exists: add blocked shots to takeaways, subtract giveaways, and multiply the result by 0.0020. This will further increase the PR-Score of players who have blocks and takeaways but don’t have giveaways.
Takeaways are seen as better than blocks as there is a definite change of possession. A blocked shot prevents a scoring chance but many times the attacking team retains puck possession.
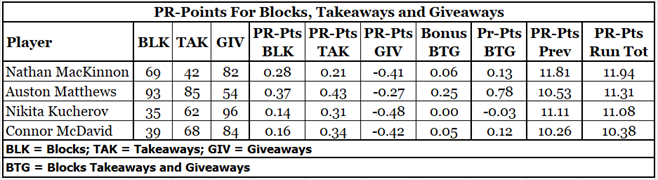
Auston Matthews is one heck of a good defensive player. He is among the top forwards in the league when it comes to takeaways and blocked shots, and he doesn’t have many giveaways, especially when you consider how often he has the puck. I mean, just compare his giveaways to those of the other players we are looking at.
With only a few data items left, all four players are comfortably in the PR-Elite category (PR-Score of 10.00 or higher), and Matthews has surged ahead because of his defensive play. What statistics remain?
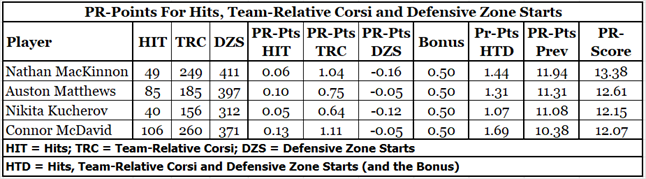
PR-Points: Hits, Corsi, and Defensive Zone Starts
Hits are included in the PR formulas even though I think the statistic has been the worst recorded of any statistic in the NHL, as hit rates vary enormously from arena to arena. The hit rates do not vary because one team hits a lot, and another team hits a little; they vary because one arena’s scorer records hits liberally and another team’s scorer records them frugally.
Hits are treated as positives even though I think a hit is a negative event. Hitting doesn’t lead to winning: losing leads to hitting.
Players get 0.0012 PR-Points per hit delivered.
Corsi is a plus/minus statistic for shot attempts by and against your team. I take it a step further and use Team-Relative Corsi: players get positive PR-Points if their team has better Corsi data when they are on the ice compared to when they are on the bench.
Team-Relative Corsi is based on 5v5 play. A player’s Net Corsi is his Team’s Corsi subtracted from his Personal Corsi. MacKinnon’s Personal Corsi is +395. In the amount of 5v5 ice time that MacKinnon had, the Avalanche would have had a Team Corsi of +146. MacKinnon’s Net Corsi is +251.
Players get PR-Points equal to their Net Corsi multiplied by 0.0040, and also get PR-Points equal to their Team Corsi multiplied by 0.0003. This could result in negative PR-Points.
Good defensive players get more defensive zone starts (DZS) than bad defensive players, so they should be rewarded for being put on the ice in a dangerous situation. Players get 0.0004 PR-Points multiplied by the sum of three times their defensive zone starts minus their offensive and neutral zone starts (OZS, NZS). This could result in negative PR-Points if players were not given chances to play in the defensive zone, and all four of our candidates were negative.
Auston Matthews had 397 DZS, 525 NZS, and 783 OZS, so he was awarded 0.0004*(-117) PR-Points for defensive zone starts (-0.05).
There is a bonus category for defensemen that does not apply to these four forwards, so the final thing to do is add 0.5 PR-Points. A player who played one game, only played for a few minutes, and had a turnover would have a negative PR-Score for the season, and nobody who plays any time in the NHL deserves to have a negative rating.
Why They Finished Where They Finished
MacKinnon won because he played the most, got the most for scoring, and didn’t hurt himself in any other area.
Matthews came second because he had a really small number of assists. If he had had 15 more assists, he would have been the Best Player.
Kucherov was significantly weaker than the other players in all areas but ice time and scoring. He didn’t do defensive things and he didn’t do faceoffs.
McDavid finished fourth because he missed six games. But even if he had played those six games at his season place, he would have finished second to MacKinnon. He only excelled at scoring; he was in the middle of this pack of four players for almost everything else.
Summary
It is possible that a different set of values for the statistics used to calculate the Productivity Rating could result in a different player being identified as the Best Player. There is no proof that the weights I use are perfect.
In the same vein, the fact that you disagree with the PR calculation process is not proof that the weights are wrong or that the results are wrong.
I didn’t design the PR system so that MacKinnon would be the highest-rated or that Matthews would not be the highest-rated player. It was designed so that the best players in the league would have higher PR-Scores than everybody else. It was honed by using the data from ten seasons of play and verifying that each season’s results seemed appropriate.
Let’s play make-believe. If I increased the value of a goal from 0.08 to 0.10 and decreased the value of an assist from 0.05 to 0.04, Matthews would be the best player in the league. MacKinnon would be second, Kucherov would be third, Sam Reinhart (F, FLA) would be fourth, and McDavid would drop to fifth.
Two of the top four players in the league would be forwards who score lots of goals but don’t get many assists. It doesn’t make sense. Obviously, if I thought it did make sense, I would have settled on those values for those statistics years ago.
One shouldn’t get too excited about personal awards, by the way. Hockey is a team game.
Related Articles