
It’s a good time to look at the players and identify the better ones. The season is about one-half over, and the All-Star break is approaching. The only way to rate and rank players, in my humble opinion, is by using Productivity Rating.
There are a couple of reasons I don’t update Productivity Ratings (PR) every day. The biggest reason is that PR is a measure of a season’s worth of play, so a single game is only worth about 1% of a player’s rating.
If you want to see the details about how a season rating is calculated given that only half a season has been played, read on. If you want to skip over the number stuff, please proceed to League Leaders in Productivity Rating.
Extrapolation
I took a copy of the necessary statistics from NaturalStatTrick.com on the morning of January 8th, 2024.
According to Merriam-Webster.com, extrapolate means “to infer (values of a variable in an unobserved interval) from values within an already observed interval.” The variables being extrapolated are hockey statistics, the unobserved interval is the unplayed part of the season, and the already observed interval is the part of the season that has been played.
It is key to understand that extrapolation is not a prediction of a player’s future, it is rather an expansion of his past. I’m not saying that Sidney Crosby is going to score exactly 48 goals, or that he is going to score close to 48 goals. I am saying that at the pace he was scoring as of the morning of January 8th, 2024, he was on pace to score 48 goals in the 2023-24 season.
The first datum that needs to be extrapolated is games played. A player who has missed four of his team’s first 40 games is not going to play 82 games.
Extrapolating Games Played
The example for extrapolation will be Connor McDavid (EDM). I might as well use somebody you know instead of some third-pair defenseman from Anaheim. To extrapolate how many games a player will play in an 82-game schedule, we need to know two things: how many games his team has played, and how many games he has played. Here are the numbers for McDavid.
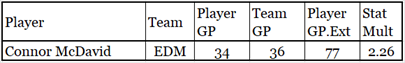
Had McDavid played every Oiler game, his GP.Ext (Games Played, Extrapolated) would have been 82, but he hasn’t so it isn’t. He’s on pace to play 77 games.
“Stat Mult” is the multiplier that will be used on the remaining statistics. It is the result of the division of extrapolated games played (77) and games played so far (34).
Technical subtleties abound. If a player has played for multiple teams, his “team games played” value was set to the league average for teams (because I’m not going to look up which is the last team the player has played for). Also, the extrapolated value cannot be more than 82 games. While it is possible for a traded player to play more than 82 games, it doesn’t happen much and an extra game would only increase his PR-Score by 1%.
Extrapolating Season Statistics
All of the statistics used for Productivity Rating are count statistics, and they will all be extrapolated in the same way. Below is the extrapolation of McDavid’s time on ice statistic.
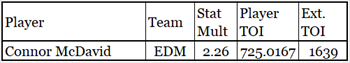
Connor McDavid’s current ice time is 725 minutes and one second (the .o167 part of his TOI stat). Multiplying 725.0167 by 2.26 produces 1638.5377, which is rounded to the whole number 1639.
I round the extrapolation to a whole number for three reasons: all of the non-time statistics have to be whole numbers (you can’t score a quarter of a goal, you can’t deliver half a hit); a couple of seconds will have no impact on a player’s Productivity Rating, and I am lazy by nature (I use the same equation for each statistic being extrapolated).
Here are a few other examples of Connor McDavid’s extrapolated statistics, none of which the average fan is interested in, but all of which are used in the Productivity Rating formula.
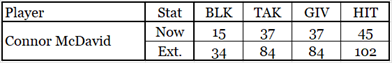
Notice that, for McDavid, the count of 37 is always extrapolated to 84, regardless of the statistic being extrapolated. If he had 37 assists, his extrapolated assist count would also be 84 (he actually had 40 assists which was extrapolated to 90).
Once all of the relevant statistics have been extrapolated, each player’s Productivity Rating Score is calculated. For those who are interested in the details, please see the article Introduction to Productivity Rating. The following table shows you the names of the categories and the number of players in each category.
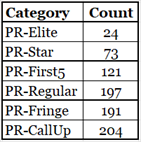
Now it is time to have some fun. Let me start by identifying those 24 PR-Elite players.
League Leaders in Productivity Rating
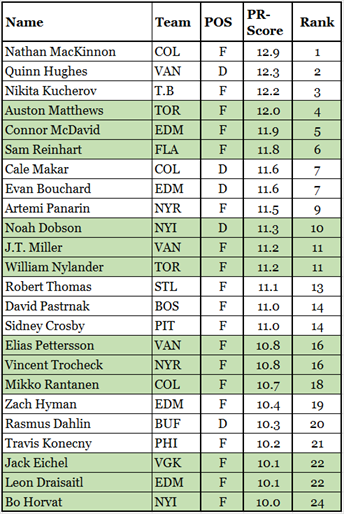
To be a PR-Elite player, you have to have a PR-Score of 10.0 or higher.
Noah Dobson, Evan Bouchard and Robert Thomas are having breakout seasons, as they have never previously rated higher than PR-First5.
Vincent Trocheck continues to improve after having missed more than 20 games in 2018-19 due to a fractured ankle. He had been at the PR-Star level in 2016-17 and 2017-18, and looked to be heading for the PR-Elite category going into 2018-19. He has been slowly returning to form, having rated PR-Regular, PR-First5, PR-First5, and PR-Star these last four seasons.
Most of the players that fans would consider to be at the elite level are included. Let’s spend a little time on the what-abouts. As in, what about Devon Toews (COL)? What about Mitch Marner (TOR)? What about Aleksander Barkov (FLA)?
Those three players are all having excellent seasons, but they are just outside the PR-Elite category. Each of them has a PR-Score of 9.9. The PR formula and the PR-Score to PR-Category conversion are cold and unfeeling formulas and are never modified because a player who “should” be PR-Elite is just outside the PR-Elite category.
Let’s look at mid-season All-Stars next.
Mid-Season All-Stars
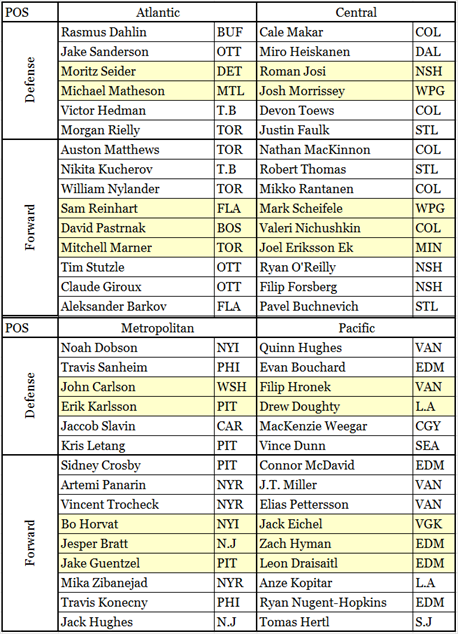
Which players should be All-Stars? At Stapled To The Bench (STTB), we believe All-Star honours should be given to the players with the highest Productivity Ratings, as they are the best players. All-Star honours are for the players, not the fans.
All-Star honours should not be spread around like participation ribbons (one minimum to each team).
All-Star honours should not be determined by fan votes. Strange fans sitting on their couches at home distributing votes is no basis for the selection of All-Stars.
As a result, four teams have no STTB All-Stars: Arizona, Columbus, Chicago, and Anaheim.
Each division’s All-Stars are grouped by position with the better players at the top of their respective sections.
It may seem strange to see the Strugglin’ Senators with three players on the Atlantic All-Star team, but it could have been stranger. The 9th-ranked defenseman in the Atlantic was Jakob Chychrun (OTT) and the 12th-ranked forward was Brady Tkachuk (OTT). Obviously, top-five talent is not a problem in Ottawa.
Leaders in Various Categories
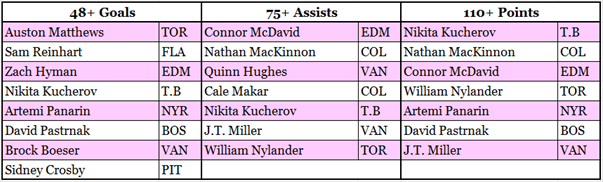
In each category, players are listed from the highest down. The first category shows players who are on pace to score 48 or more goals. I had planned to use 50+ goals as the criterion for this list, but Sidney Crosby was in 8th place and I felt it appropriate to respect his season.
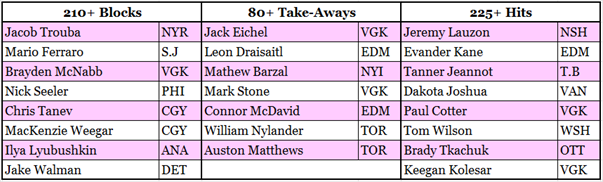
When it comes to takeaways, I noticed that three teams (Edmonton, Vegas, and Toronto) each contributed two players. Are these three teams particularly adept at take-aways, are those six players particularly adept at take-aways or do their home-town game statisticians interpret “take-aways” much more liberally than others? That sounds like a future article (The Takeaway Statistic)!
Next up are listings of the five best players on each team (three forwards, two defensemen).
Team Top Talent, Eastern Conference, Atlantic Division
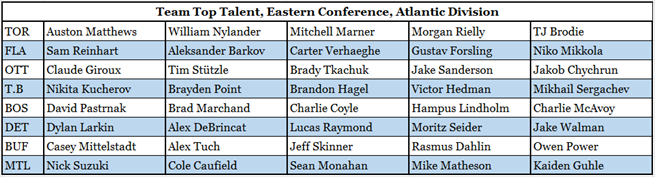
In each division, the order of the teams was determined by the total PR-Score of their top five players. Being a Senators fan, it is a little tough to put out a list with Toronto on top, but I have to respect the data.
My only solace is that Ottawa’s defensemen are better than the Leaf defensemen. Sanderson has a higher PR than Rielly, and both Chychrun and Zub have a better PR than Brodie.
Team Top Talent, Eastern Conference, Metropolitan Division
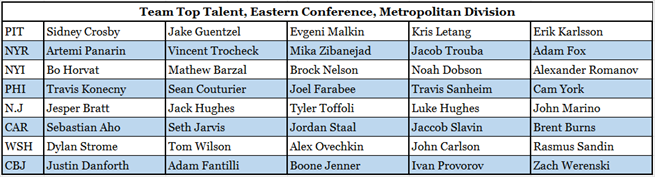
Pittsburgh’s top five players have to be the oldest quintet in the league, with an average age of 34.2.
Washington’s top five ranks 29th best in the league. Ovechkin is projected to score fewer than 20 goals and maybe outscored by Anthony Mantha (WSH) despite Ovechkin getting 60% more ice time. Has his age finally become a factor in his play?
Columbus ranks 32nd best, which is the same as ranking last.
Team Top Talent, Western Conference, Central Division
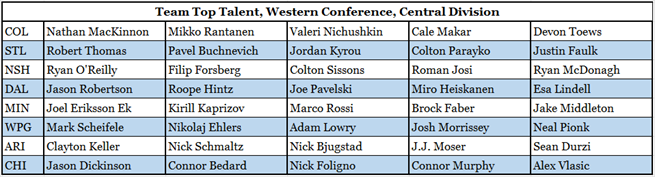
Colorado’s top five players are the best in the league.
Connor Bedard’s injury came very late in the first half of the season, so it didn’t impact his extrapolated statistics much.
Winnipeg is surprisingly low for a team that (checks the standings) is in first place in the NHL. Defensive play is not well-tracked by the statistics available, so defense doesn’t have as much of an impact on PR as it should. The main reason Winnipeg is leading the league has nothing to do with their forwards and defensemen (see Goalies).
Team Top Talent, Western Conference, Pacific Division
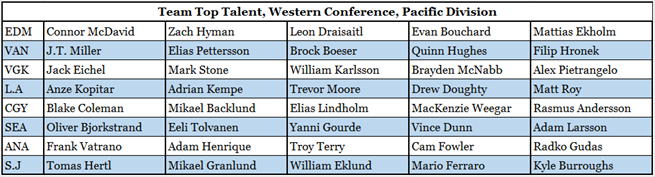
Edmonton and Vancouver’s top five players rank 2nd and 3rd in the league.
In terms of top-five talent, the difference between Seattle and Anaheim is slight. Seattle has the better defensive pair, while Anaheim’s forwards have a slight edge. In yet another lesson that top-five talent isn’t everything, Seattle’s record on January 8th was 16-14-9 while Anaheim’s record was 13-25-1.
Rookie of the Year Race
Connor Bedard (CHI) was a lock to be voted Rookie of the Year before his unfortunate injury. His projected PR-Score (shown below) is higher than it will be, as he will miss way more games in the second half of the season than he did in the first half.
There are four rookies who project to have PR-First5 seasons (PR-Score between 6.00 and 7.99), and one who projects to have a PR-Star season (PR-Score between 8.00 and 9.99). You’ll probably be surprised to see the player who should be the Rookie of the Year, based on PR, is neither Luke Hughes (N.J.) nor Connor Bedard.
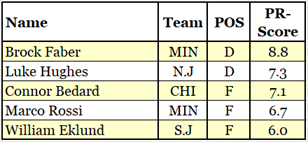
Brock Faber (MIN) projects to be in the top 70 players in the league, while Hughes and Bedard are projecting around 150th. Faber is playing a lot of minutes in Minnesota and is on track for 40+ points, which is good for a defenseman.
Hughes was being championed as the real rookie of the year by someone who was either a fan of the Devils or a sportswriter in the New Jersey area. Maybe he was a sportswriter who was also a Devils fan. Anyway, his logic was that Hughes was the better player because he had a better plus-minus than Bedard.
It’s fun to see somebody use a minor statistic to evaluate players and then prove themselves wrong. At even strength play through games of January 8th, Connor Bedard was -17 and Luke Hughes was -2. While that sounds convincing, you have to consider the teams they are playing for. The Blackhawks were -38 at even strength while the Devils were -4. Relative to their teams, Hughes was +2 while Bedard was +21. Bedard has much better plus-minus results than Hughes when you consider the teams they play for.
While I believe that “best” awards should go to the best players based on statistics rather than popularity, I would not complain if Bedard had won the prize this year, despite being so far behind Faber (1.7 PR-Score Points is a large gap).
An earlier article (Early Success is a Good Omen) showed how valuable players became based on the age they were in their first good season. It used Value Rating (VR) as the unit of measurement for a player’s success. A player having his first good season at the age of 18 (Bedard’s age) was twice as likely to become a VR-Star or better than a player having his first good season at the age of 21 (Faber’s age). Bedard is six times more likely than Faber to get to the VR-Elite level.
Goalies
In the “Top Team Talent” section, I noted that the reason Winnipeg was leading the league had nothing to do with their forwards and defensemen. They have benefited from the best goalie play in the league.
To me, the only sensible way to evaluate goalies is by looking at Goals Saved Above Average (GSAA). While save percentage and goals against average are easy for the average fan to understand, they don’t measure a goalie’s performance nearly as well as does GSAA.
A goalie can have a high save percentage because his team is good at reducing scoring chances, and a goalie can have a low goals-against average if his team reduces opponent shots. For me, what separates the goalies is how they do with shots that hit the net.
The goalies in Winnipeg have saved 24.31 goals more than expected, which is worth about 14 standing points.
Toronto and Edmonton, using the strategy of not putting their poorly-performing goalie on the ice, have reduced their GSAA problems in the last half of the first half of the season.
As this is a player-related article (rather than team-related), here are the leading goalies at GSAA60 (goals saved above average per 60 minutes of ice time).
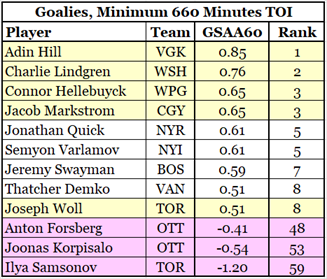
How can Winnipeg have the best goaltending in the league but their goalie is third on the list? Because teams use two goalies.
Winnipeg’s second goalie (Broissort) has a GSAA60 of 0.47, while both the Golden Knights’ second goalie (Thompson) and Washington’s second goalie are at -0.12.
In the final four rows, we see Toronto’s main goalie (Woll) is tied for 8th in the league.
Ottawa’s tandem comes in at 48th and 53rd, which harkens back to an earlier line in this article that Ottawa’s troubles are not related to top-five skater talent.
Toronto’s main goalie at the start of the season (Samsonov) is languishing in 59th place. Further bad news for Samsonov is that only 59 goalies have played a minimum of 660 minutes, so he’s in last place.
Summary
Extrapolation is something you encountered in grade school. Remember those math questions that had Bob digging four holes in two hours, and you had to figure out how many holes he’d dig in an eight-hour workday?
The answer is sixteen: four holes times eight hours divided by two hours. You extrapolate the number of holes he will dig based on the number of holes he has already dug.
Would he dig exactly sixteen holes in an eight-hour shift in the real world? I’d expect a real person would end up in the area of fourteen to seventeen holes. To me, he’s more likely to slow down as the day goes on digging holes is hard work, you get tired as the day goes on.
The “strange fans” line in the All-Star section is a paraphrase of a line in Monty Python and the Holy Grail. The speaker of the line is Dennis, who is speaking to King Arthur. Dennis, by the way, is not an old man. He’s 37. King Arthur has just declared that he is King because the Lady of the Lake gave him the sword Excalibur.
“Strange women lying in ponds distributing swords is no basis for a system of government.”
Related Articles
Introduction to Productivity Rating
The Takeaway Statistic