
This is the second of three planned articles where players who have played the best so far in 2023-24 will be identified.
Player data for this article was downloaded on the morning of January 6, 2024. Not all teams had played exactly 40 games at that point.Top 50 Skaters After 40 Games (at the end of Q2)
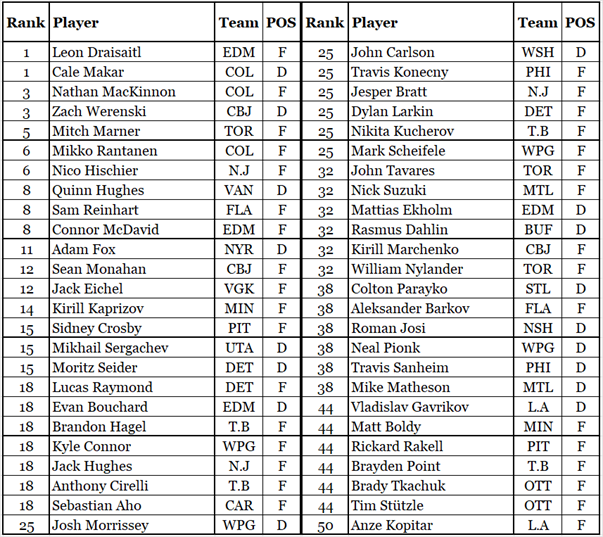
How Players Were Ranked
Players were ranked by Productivity Rating, specifically PR-Score. While the order of the players was determined by their detailed PR-Scores (four decimal places of precision), their rank (shown in the first column) was based on PR-Scores rounded to one decimal point.
For example: the table order of Quinn Hughes (VAN, PR-Score 5.1973), Sam Reinhart (FLA, 5.1838) and Connor McDavid (EDM, 5.1652) was determined by their PR-Score. They shared the same rank (8) because their rounded PR-Scores were 5.2.
Distribution of PR-Scores
The following chart shows how the PR-Scores were distributed.
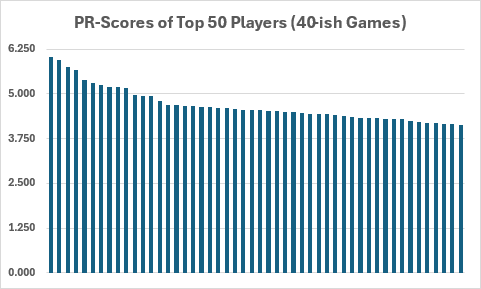
The top four players were clear leaders of the pack. After about a dozen players the differences between the PR-Scores of two consecutive players tended to be very slight.
As an aside, this chart shows the main reason I tend to avoid stating the detailed PR-Score of a player: it is very close from player to player, and the four digits of precision give an unwarranted impression of accuracy in the ratings. Is Anthony Cirelli (T.B, F) better than Sebastian Aho (CAR, F)? PR-Score says he’s presently a little better, but that isn’t as strong an argument as I’d like it to be, and I designed the PR-Score formulas.
Distribution by Position
The top fifty contains 33 forwards and 17 defensemen. One of the goals for the PR formulas was to have defensemen make up about 40% of the top-ranked players, which would be 20 defensemen in a group of 50 players. Seventeen is “close enough for statistical work.”
Distribution by Team
Edmonton, Tampa Bay and Winnipeg each have four players in the top fifty. Columbus, Colorado, Detroit, New Jersey, Winnipeg and Toronto each have three.
Dallas, with a team record of 24-13-1, had no players in the top fifty but had nine players in the top 300. Detroit, with a team record of 15-18-7, had three players (Seider, Raymond, Larkin) in the top fifty but only three more in the top 300. After their fifth-best player, their player ratings drop off precipitously.
New to the List, Dropped from the List
Every player that was added to the top 50 this quarter coincides with a player from the first quarter who was dropped.
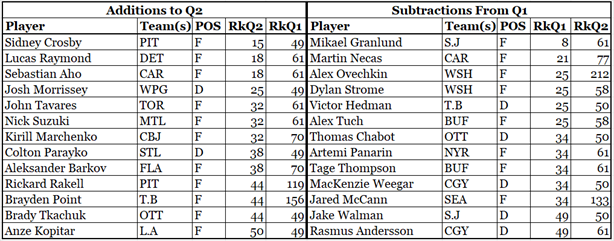
Two players stand out in the additions portion of the above chart. Rickard Rakell (PIT, F) and Brayden Point (T.B, F). Both have scored a ton in their second quarter: 21 points for Rakell, 29 points for Point.
The two players who dropped the most since Q1 are Alex Ovechkin (WSH, F) and Jared McCann (SEA, F). With respect to Ovechkin, it is hard to play when you have as many useful legs as does Long John Silver. Rather than a broken leg, McCann seems to have had a broken stick. He had 21 points in Q1 but only 7 points in Q2.
Top 5 Goalies
Goalies were rated by Goalie Expected Points, which is shortened to GxPts. It is based on a goalie’s time on ice, his goals against and his expected goals against: all game situations are included. GxPts estimates how many points an average team would get with a specific goalie in nets. For more details, see Goalie Expected Points – A Rating System.
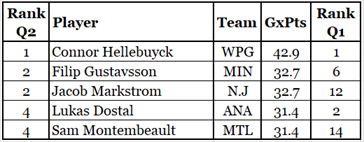
I toyed with enlarging this category to show the seven best goalies but didn’t, as I used the top five in Q1 and stuck to that out of pure obstinance. Jake Oettinger (DAL, G) was sixth with 31.3 GxPts and Juuse Saros was seventh with 31.2 GxPts.
Hellebuyck is far and away the best goalie of the season (so far). It isn’t even close.
Summary
I strive to be fair to players, but there is an unavoidable touch of unfairness to mid-season evaluations: they favour players from teams that have played the most games. Had I waited a couple of days to copy the data, there would be changes in the players ranked 30th to 50th. And then, if I had waited a couple of more days, there would have been other changes.
As a sign of respect to Ovechkin (WSH, F) and his play this season, let me inform you that he has the highest PR-Score in the league of players who have played 23 or fewer games. Mark Stone (VGK, F) has a slightly higher PR-Score than Ovechkin, but has played 25 games.
Related Articles
Introduction to Productivity Rating
Goalie Expected Points – A Rating System
2024 Progress – 60 Games