
This is the third of three planned articles where players who have played the best so far in 2023-24 will be identified.
Player data for this article was downloaded on the morning of March 1, 2025. Not all teams had played exactly 60 games at that point.
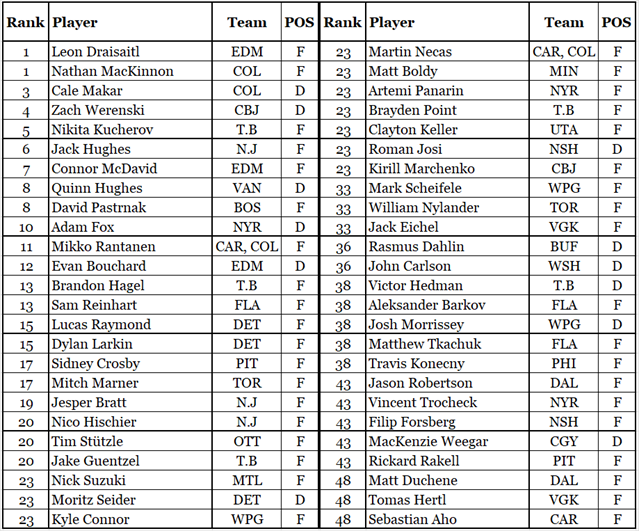
Top 50 Skaters After 60 Games (at the end of Q3)
How Players Were Ranked
Players were ranked by Productivity Rating, specifically PR-Score. While the order of the players was determined by their detailed PR-Scores (four decimal places of precision), their rank (shown in the first column) was based on PR-Scores rounded to one decimal point.
For example, the table order of Quinn Hughes (VAN, PR-Score 8.3011) and David Pastrnak (BOS, PR-Score 8.2769) was determined by their PR-Score. They shared the same rank (8) because their rounded PR-Scores were 8.3.
Distribution of PR-Scores
The following chart shows how the PR-Scores were distributed.
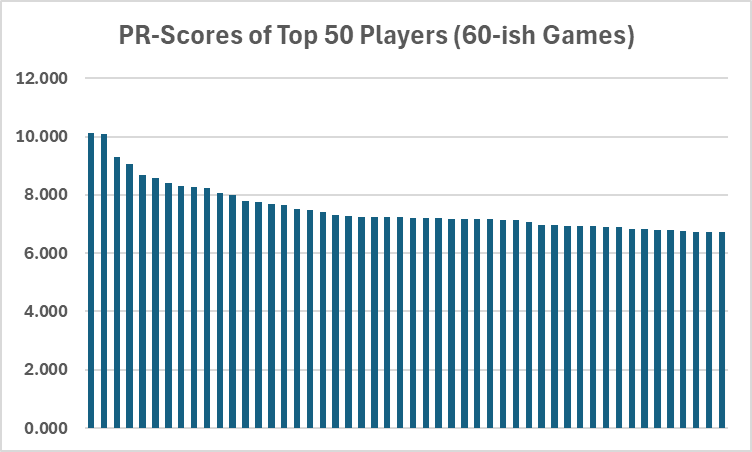
The top two players were clear leaders of the pack. After about a dozen players, the differences between the PR-Scores of two consecutive players tended to be very slight.
As an aside, this chart shows the main reason I tend to avoid stating the detailed PR-Score of a player: it is very close from player to player, and the four-digits of precision gives an unwarranted impression of accuracy in the ratings. Is Rickard Rakell (43rd, PIT, F) better than Sebastian Aho (48th, CAR, F)? PR-Score says he’s presently a little better, but that isn’t as strong an argument as I’d like it to be, and I designed the PR-Score formulas.
Distribution by Position
The top fifty contains 38 forwards and 12 defensemen, which is a little too many forwards compared to the golden ration for forwards and defensemen (30:20). Maybe it is a big year for many forwards.
Distribution by Team
Tampa Bay has five players in the top fifty. Detroit, Edmonton, Florida, New Jersey, New York Rangers and Winnipeg each have three players on the list. These seven teams make up almost half the list.
Los Angeles, with a team record of 31-18-8, had no players in the top fifty.
New to the List, Dropped from the List
Every player that was added to the top 50 this quarter coincides with a player from the first quarter who was dropped.
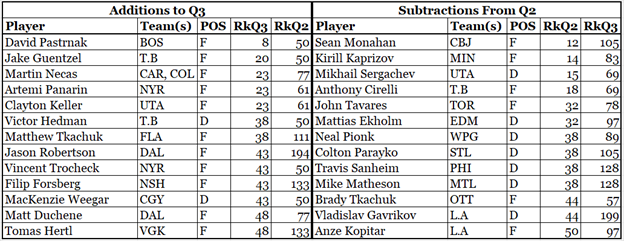
Jason Robertson (DAL), Filip Forsberg (NSH) and Tomas Hertl (VGK) have played exceptionally well over the third quarter of the season.
Sometimes, a player goes cold for a portion of the season: Vladislav Gavrikov has gone freezing cold, getting only four points over the third quarter of the season.
Top 5 Goalies
Goalies were rated by Goalie Expected Points, which is shortened to GxPts. It is based on a goalie’s time on ice; his goals against and his expected goals against all game situations are included. GxPts estimates how many points an average team would get with a specific goalie in the nets. For more details, see Goalie Expected Points – A Rating System.
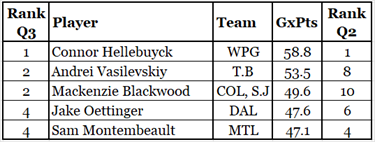
Just out of the top five are Igor Shesterkin (NYR, 46.0 GxPts), Joey Daccord (SEA, 45.7) and Logan Thompson (WSH, 44.7).
Hellebuyck’s lead is still impressive, but it’s not as big as it was after 40 games.
Summary
I strive to be fair to players, but there is an unavoidable touch of unfairness to mid-season evaluations: they favour players from teams that have played the most games.
It was fun doing these mid-season ratings, but it also confirmed that there is no way I’d increase how frequently ratings are published. It takes too much time to do it regularly.
Related Articles
Introduction to Productivity Rating