In this second article using play-by-play data from BigDataBall.com, I will identify the players who scored important goals last season (2022-23), goals that had significant impacts on the game at the time they were scored.
The statistic that will be used to determine the importance of a goal is Score-Based Expected Points (SBxP), which was explained in Score-Based Expected Points – The Value of a Lead.
SBxP Values: Precise vs. Idealized
SBxP shows how many points an average team gets given a score and a game time. For instance, in a 4-2 game in the 4th minute of the 2nd period, the leading team has an SBxP of 1.76 and the trailing team has an SBxP of 0.40. The total is not 2.00 because some games will end in a regulation tie.
Precise values for SBxP were calculated for situations from three-goal deficits to three-goal leads, by each minute of the game, based on 2022-23 game results. A chart of the values for leads and ties is below.
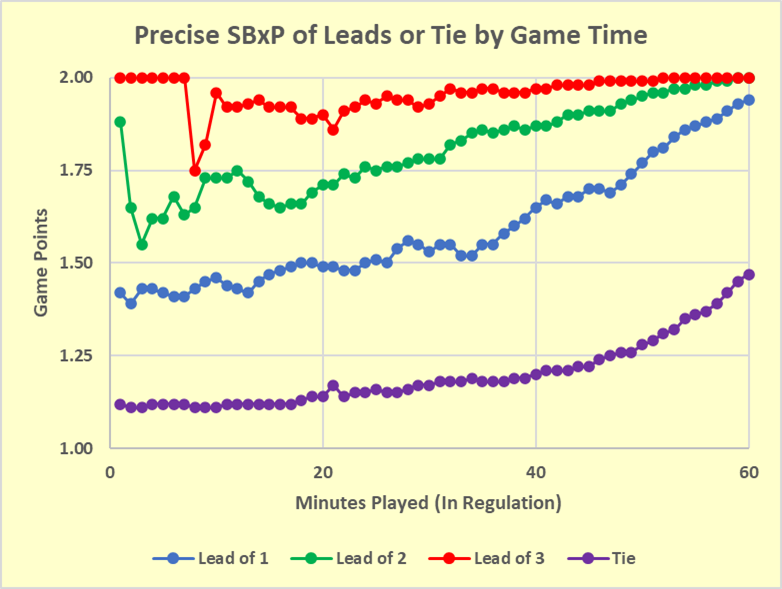
While the SBxP values are precise and the math behind them has been done correctly, the story they tell is at odds with common sense. As the points move from left to right, they should never drop: a lead in the 30th minute of the game should be worth at least as much as it was in the 29th minute, for example. Common sense tells us that a lead is more secure as the time for a trailing team to mount a comeback decreases.
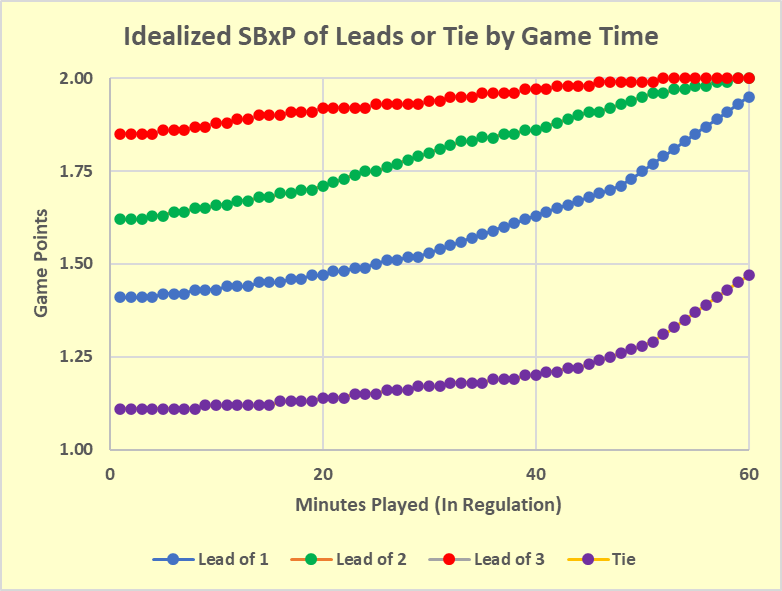
I wanted this study of important goals to be based on SBxP data that reflected common sense, so, I fudged the data. The results of my “improvements” can be seen below.
Measuring Goals for Importance
As a result of these improvements, that two-goal lead in the 24th minute is now valued at 1.74 SBxP (down 0.01 from the original) and the trailing team has an SBxP of 0.42 (up 0.02 from the original). Most of the time the improvements involved quite small adjustments.
If the leading team scores a goal in that 24th minute, they would now have a three-goal lead which has an SBxP of 1.92. That goal, for that team at that point in the game, is worth 0.18 SBxP (1.92 – 1.74). If the trailing team scores, their SBxP would go from 0.42 to 0.75: that goal would be worth 0.33 SBxP.
While we all know that some goals are more important than others, the SBxP value for goals shows how much more important goals can be. In this instance, adding to a two-goal lead would only slightly increase the winning chances of the lead team, while reducing the two-goal lead would greatly increase the winning chances of the losing team.
A Specific Example of Goal Importance from One Game
On New Year’s Eve, Montreal visited the Capitals in Washington. The table below shows all the goals in the game, who scored them, when they were scored, and their SBxP values. As an aside, it sure looks like the Montreal players had an early start to their New Year celebrations.
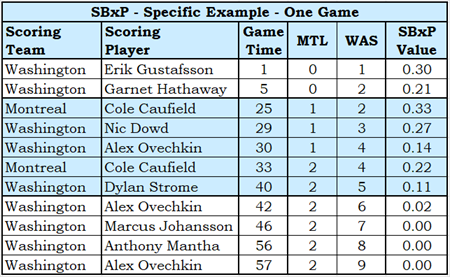
SBxP is 100% focused on how a goal changes a game at the time the goal is scored. While Nic Dowd was credited with the game-winning goal, it was not the most important goal in the game when it was scored. It was a nice goal, converting a 2-1 lead to a 3-1 lead. It was actually slightly below average in terms of goal importance (average SBxP for a goal will be noted in the next section).
Being credited with a game-winning goal can be a bit of a lottery. At Stapled To The Bench, we think the really important goals are “lead-taking goals” and “game-tying goals”; goals that have an obvious importance when they are scored.
League Leaders in SBxP
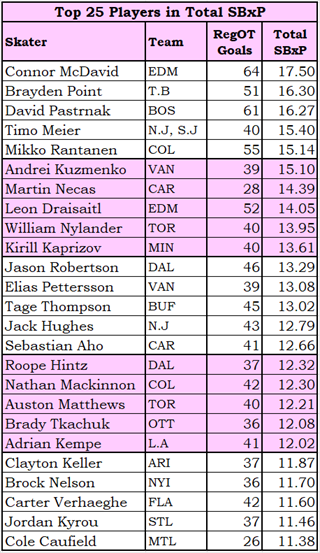
Players who have the highest SBxP in the league also scored a lot: the top 25 in SBxP averaged 42 goals in 2022-23.
I feel this listing is not quite correct. What we have is a collection of very high-scoring players, and many of their goals were less than important. They scored so many goals that their total SBxP is higher.
Mr. McDavid’s average SBxP for his goals is 17.50/64, which is 0.27: the league average was 0.30. McDavid scored some important goals, but he also scored many less-than-important goals.
There is another way of looking at this. While McDavid scored goals in what turned out to be routs, the games turned out to be routs because he scored goals. Bit of a vicious circle, isn’t it?
Cole Caufield did very well for a guy who played a little over half the season and, when healthy, was playing for Montreal.
One could argue that the search for the players who score important goals is done, but I want to search further. All I have done is find the players whose SBxP total is highest, and to me, that is not the same thing as scoring important goals. These players could have just scored a lot of somewhat important goals.
Does the scoring of a lot of goals that have a value of 0.22 SBxP mean that the player scores important goals? I’m not convinced that it does, in the same way that four singles is not the same thing as a home run in baseball. Let’s refine the question: who scores key goals?
Key Goals and Trivial Goals
I’m going to divide goals scored into three categories.
Key Goals have an immediate impact on the state of the game, and they are worth at least 0.40 SBxP. Two examples of key goals are third-period goals that tie the game and third-period goals that give a team a one-goal lead.
Trivial Goals have a very slight impact on the state of the game and are worth 0.10 SBxP at the most. Examples are third-period goals that give a team a three-goal lead and goals scored when a team is down by five or more goals.
The third category of goals is, well, goals. Ordinary goals? They are best described by what they aren’t: They are not Key Goals and they are not Trivial Goals. Most goals fall into this third category, and I’ll be ignoring them for the rest of this article.
League Leaders in Key Goals
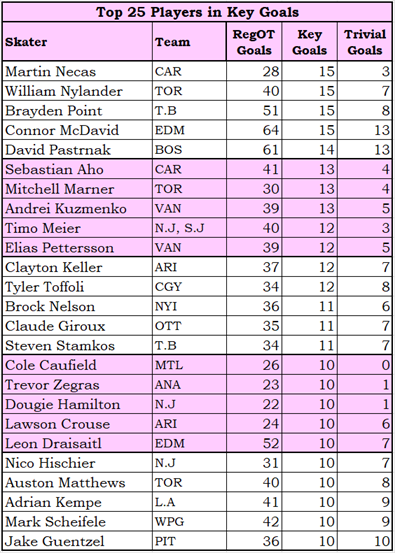
Players were sorted by the Key Goals they scored (descending order) and then by the Trivial Goals they scored (ascending order), producing the table on the left.
There is a four-way tie for first place at 15 Key Goals. Martin Necas (CAR) only scored 28 goals, but 15 of them were key. He is the only player in the league who scored a non-trivial number of goals with the majority of them being Key Goals.
Toronto has three players on the list, and those players are in a surprising order. Nylander (15) is ahead of Marner (13) is ahead of Matthews (10).
Most of the top key-goal scorers come from good teams, but the list also includes players from Vancouver (Kuzmenko and Pettersson), Arizona (Keller and Crouse), and Anaheim (Zergas). Key goals don’t always lead to wins.
And look at Cole Caufield showing up on this list, having played just over half a season and having played for Montreal. That was an impressive performance.
League Leaders in Trivial Goals
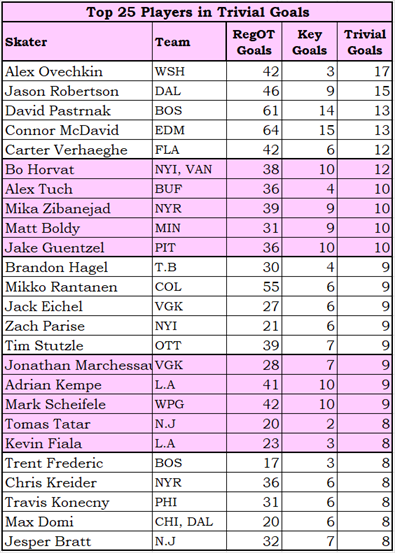
I usually avoid saying negative things about players not named Ryan Reaves, but scoring Trivial Goals is not necessarily a negative thing. David Pastrnak (BOS) and Connor McDavid (EDM), third and fourth on the list, would likely point out it is not their job to stop themselves from scoring: that’s their opponents’ job.
Ovechkin (WSH) had a comfortable lead in Trivial Goals and rarely scored a key goal. He was the Usain Bolt of Trivial Goal scorers.
As with the top key goal scorers, the top trivial goal scorers come from a mix of good and bad teams.
I’m not sure what to make of teams that had different players on the two top 25 lists. On New Jersey, Dougie Hamilton scored 9 Key Goals and 1 Trivial Goal (9-1), while Tomas Tatar scored 2 Key Goals and 8 Trivial Goals (2-8). It could have been caused by the different ways the players were used, I suppose.
Maybe Tatar had a lot of empty net goals?
Empty Net Goals
This is as good a point as any to discuss late-game scoring.
Tomas Tatar scored four empty-net goals and Ovechkin scored six. Late-game empty-net goals are always considered to be Trivial Goals. A team with a one-goal lead in the last minute of the game has an SBxP of 1.95. If they score they change their SBxP from 1.95 to 2.00: a trivial difference.
I will grant that the main reason the last-minute one-goal lead has an SBxP of 1.95 is that the leading team gets an empty net goal more frequently than they concede the tying goal, but the most frequent thing that happens is that neither team scores, and the one-goal lead is maintained through the end of the game.
Now, let’s look at this from the other side. What is the value of scoring late in the game when one-goal down?
A team with a one-goal deficit in the last minute of the game has an SBxP of 0.16, while a team that is tied in the last minute has an SBxP of 1.47. That is a difference of 1.31 SBxP, and that is massively valuable.
Pulling the goalie gives the trailing team a chance to increase their SBxP by 1.31 while risking only 0.05 SBxP: the payoff is 260 times more than the risk.
Summary
The player with the highest SBxP was Connor McDavid (EDM). He led the league in total SBxP because 64 goals of varying levels of importance can add up quickly. This wasn’t a direct answer to the article’s question: I wanted to find players who scored important goals, not necessarily players whose total SBxP was high. Thus the idea of Key Goals and Trivial Goals was introduced.
Four players tied for the lead league by scoring 15 Key Goals: Martin Necas (CAR), William Nylander (TOR), Brayden Point (T.B), and Connor McDavid (EDM). It could be this was a one-season fluke for these players or it could be a regular occurrence. As noted in The Value of a Lead, the play-by-play data is not free and I’m not willing to spend more of my beer money to buy the data to do that research.
At the other end of the listings, Alex Ovechkin (WSH) led the league in scoring Trivial Goals with a total of 17. Jason Robertson (DAL) was two back while David Pastrnak (BOS) and Connor McDavid (EDM) were two more back.
Related Articles
