
Having recently conducted some research into teams that could be called the Kings of the Road, I thought I’d examine the players. The team-level data strongly indicates that being a Road King is a random occurrence. Will the player-level data produce the same conclusion? Do players control whether they are Kings of the Road, or does it just happen every now and then?
In the interest of (my) time, I will only look at players over the last three full seasons, from 2021-22 to 2023-24.
Introduction to King of the Road (KOTR) Rating
I had thought I would use Productivity Rating to determine whether a player was a Road King. A player would be a Road King if his PR in road games was higher than his PR in home games. I ran into a couple of issues that dissuaded me from using PR.
First, PR is designed for 82-game seasons, not 41-game subsets of seasons. Second, a lot of data has to be accessed to do PR calculations. To address these two concerns, I developed KOTR Rating, which is based on PR.
See the section KOTR Calculation Steps for a full description of how KOTR Rating is calculated. This will be especially useful to you if you are having a hard time sleeping.
There will be a minimum time qualification to qualify for consideration as a KOTR: a player must have played at least 410 minutes in both road games and home games. The reason for this is that a fringe player being more effective on the road would have no impact on his team’s winning chances.
A qualified player is considered a King of the Road if his road KOTR-Score is at least 0.3 greater than his home KOTR-Score: I did not want to identify a player as a KOTR due to a lucky bounce or two.
KOTR – League-Level Counts
The following table shows the number of players who qualified for KOTR consideration in each of the last three seasons, the number who were deemed to be KOTR, and the percentage of qualified players who were deemed KOTR.
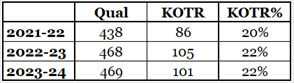
Statistically speaking, that’s a whole lot of the same thing. Over the three seasons, about 21% of qualified players were deemed to be Kings of the Road.
KOTR – Consistency at the Player Level
This is the big question: Are players consistently Kings of the Road? If KOTR is “controlled” by players, then there would be considerably more players frequently being KOTR than there would be if it was a “random” occurrence.
To investigate, I first looked for players who qualified in all three seasons: there were 298.
If KOTR was a random occurrence, how many of those 298 players would be KOTR in all three seasons? Using the three-year average of 21% of players being KOTR, the estimate for the number of players that would be KOTR all three seasons would be:
298 * 0.21 * 0.21 * 0.21 = 2.76 = 3
Of those 298 players who qualified all three seasons for KOTR, only three of them were KOTR all three seasons.
How many players would be KOTR two times in those three seasons if it was a randomly occurring phenomenon? That would be:
298 * 0.21 * 0.21 * 3 = 39.43 = 39
The “3” in the formula that is just to the left of the first equal sign represents the three ways in which a player could have been a KOTR twice: in 2021-22 and 2022-23; in 2021-22 and 2023-24, and; in 2022-23 and 2023-24.
The actual number of players who were KOTR twice is 37.
This very strongly suggests that KOTR, at the player level, is a completely random event.
Is there any reason to name names? No, there isn’t. Identifying the players who were Kings of the Road for three straight seasons would be like identifying players whose social insurance number contains three consecutive digits that are “726.” These players do not have a special hockey skill; they just randomly played better for three seasons in a row.
KOTR by Player Level
Higher rated players (PR-Elite, PR-Star) were KOTR less frequently than lower rated players (PR-First5, PR-Star and PR-Fringe): the respective rates were 14% and 22%.
The more a player plays, the more likely his data will reflect standard patterns, a statistical phenomenon where values tend to move closer to their expected state as their quantities increase. Higher-rated players get more ice time in a season, which increases the quantities of their statistics (more goals and blocked shots, for example), and the expected state is that players have better data from their home games.
The more time a player plays, the less likely he is to be a King of the Road. This is another nail in the coffin of KOTR being a player-controlled event.
KOTR Calculation Steps
The following table shows the statistics used to calculate KOTR-Score, the values of the statistics and each statistic’s KOTR-Points (KR Pts). The detail column gives a little extra information about a particular calculation. Our exemplar is Joel Eriksson Ek (MIN, 2022-23) and his away game data.
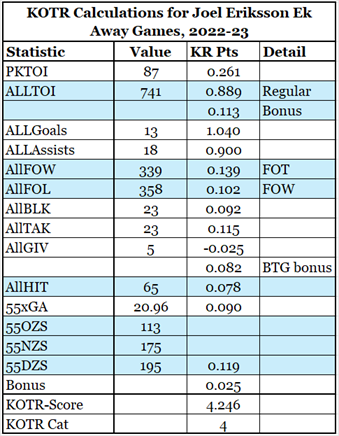
Penalty-kill time-on-ice produces 0.003 KR-Pts per minute.
All time-on-ice produces 0.0012 KR-Pts per minute, with a bonus of 0.0009 KR-Pts for all time over 615 minutes. 615 comes from 15 minutes per game over 41 scheduled games.
Goals and assists produce 0.08 and 0.05 KR-Pts per goal or assist.
Players get 0.0002 KR-Pts for each faceoff they took (697 for Joel) and 0.0003 KR-Pts for each faceoff they won.
Players get 0.004 KR-Pts per blocked shot, 0.005 KR-Pts per takeaway and lose 0.005 KR-Pts for each giveaway. Players are awarded a BTG bonus of 0.002 times (BLK + TAK – GIV).
Each hit is worth 0.0012 KR-Pts.
The next category is not used in Productivity Rating. Players are awarded 0.05 KR-Pts for the difference between their 5v5 expected goals against and their defensive-zone-faceoff-percentage balanced expected goals against. This idea is more fully described in the Defensive Forwards article. Mr. Eriksson Ek has a positive value for 55xGA, meaning his expected goals against value was lower than would be expected of a player that had defensive zone faceoffs 40% of the time.
Players are rewarded for their 5v5 defensive zone faceoffs through the following formula:
0.0004 * ( 3 * DZS – OZS – NZS)
Finally, each player is awarded a bonus of 0.025 points to ensure their KOTR-Pts is positive.
In 2022-23, Joel Eriksson Ek had KOTR-Scores of 4.25 on the road and 4.19 at home. Because his road KOTR was only slightly higher than his home KOTR, he was not considered a King of the Road.
Summary
Being a Road King, either at the team level or at the player level, is a random event. If your team’s colour commentator says otherwise, he’s taken one too many pucks to the head. That the last two Stanley Cup winners were Kings of the Road is merely a coincidence.
The distribution of KOTR status among forwards, as shown in this article, is almost certainly random.
In a poker tournament I once played, I was dealt AA in two consecutive hands. Getting AA twice in a row was simply a rare occurrence. I’ve played enough tournaments that it should have happened to me at least once.
Unusually, I won both hands. Typically, I didn’t make it to the money.
Summary Part Two
I have a feeling that the formula used for KOTR-Score may well better measure a player’s productivity than the PR-Score formula. They differ in one area: PR-Score uses team-relative Corsi (TRCor), KOTR-Score uses defensive-zone-balanced expected goals against (DZBxGA).
This is a case of I wish I knew five years ago what I know now. The idea of using TRCor was to reward players whose Corsi data was better than that of their team: I assumed these players either drove their team’s offense or stifled the opponent’s offense. At the time, I did not know how much Corsi and xGA data was influenced by a player’s “zone balance”.
Defensive Zone Balance (DZB) is the percent of defensive zone faceoffs a player is involved in. In 2022-23 road games, Josh Morrissey (WPG, D, 716 minutes 5v5 ice time) had a DZB of 29%, and Andrew Peeke (CBJ, D, 715 minutes 5v5 ice time) had a DZB of 43%. Obviously, Morrissey should have better Corsi and xGA data than Peeke.
Interestingly, Morrissey’s xGA data is slightly worse than Peeke’s: 36.0 to 34.8. As a result, Morrissey got a negative score for his DZBxGA (-0.35), while Peeke got a positive score (+0.08). Morrissey had a better total KOTR-Score than Peeke (3.66 over 3.50) because he scores a bit more frequently (30 points over 5 points).
Should I change the PR-Score formula? Do I do it starting with 2024-25, or do I re-calculate PR for all 17 seasons? How much would PR-Scores change for the players? When do I have to start cooking supper tonight? How would this impact the articles that used PR-Score?
These questions nag at me in the back of my mind, all day long.
Related Articles