
It took me an embarrassingly long time to figure out how to recognize back-to-back games from the game data that is on NaturalStatTrick.com. My problem was that subtracting one date from another in Excel kept giving me another date. The solution was changing the format of the result cell from Date to Number! (It defaulted to Date because both source fields for the subtraction were Dates.)
While it would have been less humbling to have figured this out months ago, now that I have figured it out I am going to use the fruits of my labour. In this article I will look at several issues in the neighbourhood of “back-to-back” games.
Results in Back-to-Back Games
At the league level, teams do not do well in the second game of back-to-back games. The following table shows the league record in all games, in the second of back-to-back games, and in games that were not the second of back-to-back games.
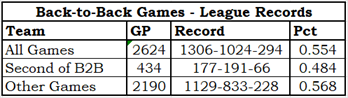
The cost to a team of playing back-to-back games is not trivial. Looking at things from the perspective of an 82-game schedule, the average team goes from playing like a 93-point team (0.568) to playing like a 79 point team (0.484). Using 2021-22, the average team goes from playing like Vegas did (43-31-8, 0.573) to playing like Columbus did (37-38-7, 0.494).
Back-to-Back Games, Home and Away
I was surprised to see that the second of back-to-back games happens much more frequently on the road than at home: 287 road games, 147 home games. It’s almost exactly a two-to-one ratio.
As I frequently do when looking at decisions that impact workers negatively, the reason this happens is that the senior management of the league wants to shorten road trips to reduce travelling expenses (fewer nights in hotels, fewer daily expenses). Basically, if it saves the league a buck, screw the workers.
On the other hand, I’m sure this is somewhat covered by negotiations between the players union and the league, so it is not a one-sided decision. Players probably want to get home as quickly as possible, and if that gives them a few back-to-backs, they do not mind.
I was more surprised to see that teams playing on the road in the second of back-to-back games are better than teams playing at home for their second of back-to-back games. The point percentages are 0.495 on the road, 0.463 at home.
Optimum Amount of Between Game Rest
We have just seen that teams play poorly when they have no rest between games and that, as is the obvious result, they play better when they have some rest between games. Is there a sweet spot, an amount of rest that produce the best results for a team? Yes, there is.
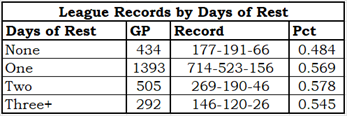
I am not going to be pedantically precise in my answer: the optimum amount of rest for a team is one or two days. There is almost no difference between one day of rest and two days of rest, and there is plenty of difference between those two and no days of rest or more than two days of rest. Any amount of rest is better than no rest at all.
Rest is a Weapon
“Rest is a weapon” is a touchy phrase in Ottawa. Former coach Guy Boucher would say “Rest is a weapon” and give players days off instead of giving them practices. General Manager Pierre Dorion was quoted as saying, “If I hear that one more time, I’ll go crazy.” In case you do not know how this disagreement in non-game workload went, you can infer it from the phrase “former coach.”
Having run the numbers, I see that Guy had a point. The following table shows the home team’s record based on whether they had more rest than their opponents, the same amount of rest, or less rest.
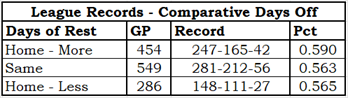
Having more rest than your opponent is a good thing. It might be a weapon.
Back-to-back Games – Team Level Highlights
Teams played consecutive nights between 10 and 18 times in 2021-22. Edmonton was the least burdened team while the Islanders and the Coyotes were the most burdened. Eight of the 32 teams played better in the second of back-to-back games than they did overall.
The Tampa Bay Lightning and the Colorado Avalanche were great when playing their second game in two nights. Colorado was 8-2-1: 2-0-0 at home, 6-2-1 on the road. Tampa Bay was 9-0-3: 1-0-3 at home, an amazing 8-0-0 on the road.
The Panthers were 7-6-1 in their second games, meaning they were 51-12-5 otherwise. Their second games cost them 7 points in the standings. They finished first as it was, so it is not possible that they could have finished more first if they had played those 14 games better.
Three teams separated themselves from the league at the wrong end of this matter. The Flyers were 2-9-5; the Devils were 3-12-2; the Kraken were a woeful 3-10-0.
Summary
I like busting hockey myths, but I did not expect to do that for the myth that “teams lose more often than normal when playing the second of back-to-back games.” And, if you read all of this article, you will see that the myth was confirmed instead of busted. Hockey is a hard game, and playing two games in two days has got to affect the players.
The data does not tell me how teams lose more frequently. I would expect that the reason is teams do not play as well as when they are rested, so every measurable aspect will be worse once you have enough data to measure.
The optimum amount of rest to have before a game is one or two days. It is better to be more rested than your opponents.
For the fans of the Maple Leafs, I can tell you they played 13 games with no rest. I could tell you more, but I have already lost interest in them.