In the article The Value Of A Draft Pick a method to translate Productivity Rating (PR) to money Return From Play (RFP) was described. That method was subsequently used to identify teams who have drafted well (or poorly) in the article Who Has Drafted Well?.
This article looks at the draft classes (a draft class is all the players drafted in one year) from 2007 to 2016 and ranks them from lowest total return to highest, from least to the beast. Some of the details I’ll share for each draft class will be its total RFP, the number of drafted skaters who played in the NHL, and its best players (highest RFP). At the end of this article, the highest-ranking players from each draft group will be identified.
To reduce the number of numerals in this article, player returns will usually be stated in millions of dollars ($10M means $10,000,000).
Study Details
Return From Play converts a player’s PR-Score into a dollar value that respects the NHL salary cap for the 2021/2022 season. In this study, the PR-Scores from the first six seasons after players were drafted were translated to RFP and added together. For example, Jake Guentzel was drafted in 2013 and his total RFP from 2013/2014 to 2018/2019 is $13.7M. Of 936 drafted players in the ten draft classes being studied who made it to the NHL, he ranks 126th. One of the reasons he is ranked below where you’d think he would be is that he didn’t play any NHL games in his first three post-draft seasons. Another reason is that he is playing well now, which is more than six years after he was drafted.
From there, it was a simple (for the computer) task to add together the RFP for all players in a specific draft. Jake’s 2013 class came in with a total return of $544.8M.
The draft classes are discussed in very light detail, starting with the lowest rated draft class and working upwards to the highest rated class.
Class of 2007 (86) $421.5M
The draft class header (above) shows the class’s year, the number of drafted skaters from the class who played at least one game in the six seasons after the draft, and the total RFP of all those skaters (in the six seasons).
2007’s draft class was quite unimpressive compared to the other classes. Only one other class (2014) had fewer skaters make it to the NHL. And most of those that made the NHL didn’t have a huge impact: he 2007 class has the fewest skaters who had a return of $10M or more.
There was some talent in this group: lowest doesn’t mean zero and most doesn’t mean all! Patrick Kane is the best player ($35.0M), which is the ninth highest return in all ten classes.
Class of 2010 (90) $451.9M
Coming up to this draft, all the talk was “Taylor vs. Tyler.” Usually, it’s pretty obvious who will be drafted #1, but that wasn’t the case for the 2010 draft. Six years after the draft, there was still very little difference between them.
Tyler Seguin, drafted number two, returned $31.8M to lead this draft class and Taylor Hall was drafted number one and returned $28.2M for second place.
Mark Stone is frequently held out as an example of the value you can get late in the draft, as he turned out to be a very good player after being drafted at slot 178. He ranks 1oth in the class of 2010 ($12.7M) because of the six-season time frame. He didn’t fully crack the Ottawa lineup until 2014, his fifth post-draft season. Most of the players in front of him played at least two full seasons more.
From a career perspective, the importance of a strong start (or a weak start) is telling. Despite Mark Stone being the best player in the 2010 class since 2016, he has only passed four of the players that were in front of him at the end of the 2015/2016 season. After twelve seasons Mark Stone ranks 7th in RFP in his class. He may pass one or two more players if he continues to play at a high level.
Class of 2014 (84) $513.6M
2014 is the shallowest of the ten classes, with only 84 skaters having made it to the NHL. It does have some nice top-end players. In Leon Draisaitl ($38.7M) and Aaron Ekblad ($32.9M) they have two of the top twelve highest RFPs in the ten classes. In all, seven skaters had a return of $20M or more.
Class of 2012 (91) $519.7M
This is the only class with no player having a return from play greater than $30M. Hampus Lindholm led at $24.5M and stands 40th in RFP among all drafted players in the study.
Despite the lack of top-end talent, the class of 2012 finished 7th of the ten classes. It had fifteen skaters in the $10M to $20M RFP range, tied for the most of any class.
Class of 2016 (102) $534.6
2016 was the second deepest class, with 102 skaters making it to the NHL. Its talent profile is … strange.
Ten players had a return greater than $20M, tied for second highest among (2008 had ten, 2015 had eleven). In the middle tier of RFP, 2016 had only five players between $10M and $20M: the next lowest class had nine, and the average class had twelve. In the bottom tier (less than $10M) 2016 had 87 skaters, the most of any class. It’s talent profile is a bottom heavy hour glass.
Auston Matthews is class valedictorian at $48.0M, followed by Matthew Tkachuk (13th out of all drafted players), Charlie McAvoy, Alex DeBrincat and Adam Fox.
Class of 2013 (91) $544.8M
2013 was a very top-heavy draft. The total return from its five best players is second only to the best draft class in the study (no spoiler here as to which one is the best class).
Those top five players are Seth Jones ($37.0M), Nathan MacKinnon ($36.2M), Aleksander Barkov ($34.6M), Sean Monahan ($32.5M) and Rasmus Ristolainen ($31.7M). All five are in the top 20 of drafted players, in terms of RFP. In seven of the ten classes, fifth-place Ristolainen would have been in the top three.
Elias Lindholm is sixth in this class. It’s a pretty good class when Elias Lindholm is a “step down” from the better players.
Nathan MacKinnon is allegedly a distant relative of yours truly, on my mother’s side, but I’ve never received a Christmas card from him or his family. Having done a little family research, I can attest that almost every family in Cape Breton in the 1870s had the last name MacKinnon.
Class of 2011 (107) $553.0M
The class of ’11 is deep, but not thick. It had more skaters reach the NHL than any other class, but only one of its players was over $30M RFP: Gabriel Landeskog ($30.5M).
Despite having more skaters make it to the NHL, 2011 ranks behind 2009 because of the top end talent in each class. Only Landeskog had a return of $30M or more, while there were five such players in the class of ’09.
Looking at the top five players in each class, 2011 ranks third last, ahead of only 2012 and 2007. It got to fourth place in these rankings because fifteen of its players are in the $10M to $20M RFP range.
Class of 2009 (98) $555.1M
The class of 2009 just edged out the class of ’11 on this list. This class had five draftees in the top 25, while 2011 had just one (Gabriel Landeskog 24th).The top five players from 2009 had a total return of $162.5M, while the top five from 2011 returned $124.7M, a difference of $37.8M. It says here that almost $40,000,000 is a lot of value!
Class of 2008 (91) $616.5M
The second-highest rated draft class came one year after the lowest rated draft class. I doubt that hockey executives spend much time bemoaning their lack of luck, but some of them must have been a little annoyed that they had a high draft pick in 2007 and not in 2008.
Steven Stamkos ($42.2M), Drew Doughty ($39.3M), Alex Pietrangelo ($32.1M), Erik Karlsson ($29.9M). Four players were in the top 30 overall, seven in the top 50.
Six of the top seven players in this class were defensemen, with the other three being John Carlson, Luke Schenn, Tyler Myers. Forget the Blue Plate Special at the local diner: this class was the Blue Line Special.
Class of 2015 (95) $731.0M
2015 was Connor McDavid’s class, but he didn’t put them in first place by himself. The 2015 class would be comfortably in first place if you didn’t include McDavid’s $54.0M and Ivan Provorov’s $32.8M. Subtracting Sebastian Aho’s $32.4M would put them a little below the class of 2008.
Five of this class are in the top 25. Those other two players are some guys named Mitchell Marner ($31.9M) and Jack Eichel ($30.9M). Mikko Rantanen is sixth at $28.8M and Zach Werenski is seventh at 27.9M, which is $3M higher than any player from the class of 2012.
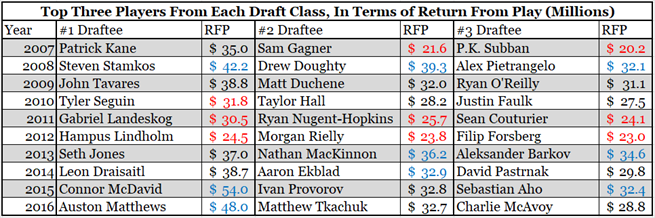
Appendix – Top Players In Each Draft Class
This table shows the top three players for total RFP in each draft class. If a player’s value is in blue font, then the player is one of the top three in his column. Red font in the value indicates the player is in the bottom three in his column.
Being one of the bottom three top-three players is no slight: P.K. Subban, in his first six seasons, was one hell of a good player.