
Through a series of unfortunate travel events, my wife and I were still in Ottawa on the night of January 16th, 2024. We were supposed to have been flying to visit family on the other side of the continent, but the first of our two flights was so late arriving we weren’t going to make our connecting flight, and no other flights would get us to our destination that day.
We returned home, ordered a pizza, and settled down to watch the Senators play.
Ottawa scored first and a graphic came up showing that Ottawa had given up 30 goals in the five minutes after having scored a goal. And, as if it was planned, Colorado scored 38 seconds later. Heavy sigh.
My immediate reaction to the graphic that was shown was that the statistics lacked context and balance. This sent me on a course of investigation that took two weeks.
I will start with a slight aside, discussing whether “goals scored within five minutes of having scored” is even a “statistic”. Then I’ll get into what “context” and “balance” mean. And then I’ll share the results of my investigation.
Is “Goals Scored Within Five Minutes of Having Scored” a Statistic?
In my opinion, a statistic is a countable fact (or based on a countable fact) that occurs during gameplay. Faceoffs won is a count statistic, while Faceoff winning percentage is a rate statistic that is based on count-statistics (faceoffs won divided by faceoffs taken).
Another requirement I have to consider something a statistic is it has to have some chance of being important to the game. The length of time it takes to perform the national anthem can be precisely recorded, but it is not a statistic.
Goals-Within-Five-Minutes-Of-Having-Scored-A-Goal is a statistic. It is a “subset statistic.” Goals have many subsets: you’ve got power-play goals, you’ve got empty-net goals, overtime goals, short-handed goals, game-tying goals, tie-breaking goals, goals scored in the first five minutes of a period, and goals scored within five minutes of a previous goal.
I need a name for this statistic so that I can stop typing “goals scored within five minutes of having scored a goal.” I will use W5MG: Within Five Minutes Goals. Actually, W5MG will be the prefix for several statistics that are all related to this general topic.
New Statistics: Context
Context is “the parts of a discourse that surround a word or passage and can throw light on its meaning.” In this case, W5MG was surrounded by nothing.
If I were to tell you it takes me four-and-a-half hours to drive from Ottawa to Toronto, what would that tell you about my driving? Do I go faster than the average driver, or slower? You have no way of knowing, as you are missing context. You don’t know what part of Ottawa I’m starting in, what part of Toronto I’m ending in, whether I stop for gas and/or a doughnut during the trip, and whether I count the stopped time in my travel time.
When Stapled To The Bench presents a new statistic, great lengths are taken to provide context. Are high numbers good or bad? What is the average number? What are the highest to lowest values? Are observations grouped in the middle or at one of the ends? None of that information was presented during the broadcast, and all of those are context questions.
To get context for W5MG statistics, I needed goal-scored data (which team scored, when they scored, what happened in the following five minutes). I purchased play-by-play data from BigDataBall.com for the 2022-23 season, and that can be used to get the context.
Unfortunately, the BigDataBall data is for last season, but a full season’s worth of data that is only one season old is much better than half a season’s worth of data that I am too cheap to purchase.
New Statistics: Balance
By balance, I mean “having different parts or elements properly considered. ” There are four statistics that would provide balance: W5MG (within five minutes goals) given up after a team has scored; W5MG scored after a team has scored; W5MG given up after a team has been scored on, and; W5MG scored after a team has been scored on.
While Ottawa has given up way more W5MG after having scored than fans like, they have also scored themselves within five minutes of an earlier goal. In the game with Colorado, Ottawa took a 4-2 lead a few minutes after having taken a 3-2 lead.
Did Ottawa ever score within five minutes of the opponents scoring? Or (in a question coming from Worst Case, Ontario) did they give up a subsequent goal within five minutes of having been scored on? As Colorado turned a 4-2 deficit into a 7-4 victory, Ottawa gave up a couple of that type of goal.
I can also use the data from BigDataBall.com to get the balance I want.
Now it is time to move into the context of W5MG by looking a little more closely at W5MGA, which is the datum that was presented for Ottawa that triggered this article. W5MGA is a count of goals a team has conceded within five minutes of their having scored a goal.
2022-23 W5MGA – League Totals
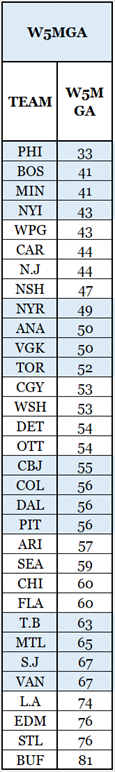
This first table shows the league standings for W5MGA from 2022-23, from best (fewest W5MGA) to worst (most W5MGA) My immediate reaction to seeing the order of teams on this list was: does W5MGA mean anything at all?
The best team in the league was … Philadelphia? The 31-38-13 Flyers? The team that finished eleven points behind the Senators? With all due respect, the Flyers weren’t the best at anything last year.
The actual good teams in the league last season (Boston, Carolina, New Jersey, Vegas, and Toronto) are all in the top twelve, so maybe W5MGA means a little something. But then again, Vegas and Toronto are in the same general area as Anaheim, which was the worst team in the league.
It looks like W5MGA is accumulated at random. A poor team is leading the league, and two of the top ten teams in the league (Los Angeles, and Edmonton) are in the bottom four.
Ottawa, having given up 30 in the first half of the season, is on pace to give up a little over the 2022-23 league average (56 in 2022-23) this season. Given the way 2023-24 has been going, having a “league average” statistic feels like an accomplishment rather than a problem.
What is needed to better understand W5MGA is a little more context.
2022-23 W5MGA – Team Offense and Defense
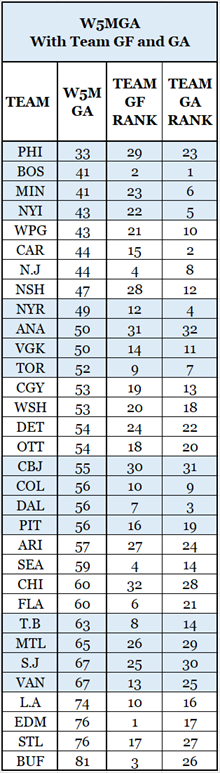
This next table shows W5MGA and two other pieces of information: a team’s rank in offense and defense.
The league leaders in W5MGA were, by and large, weak offensive teams (Boston and New Jersey excepted[AO1] ). By not scoring much, they had fewer opportunities to concede W5MGA.
The league-leading teams are also top-twelve defensive teams (Philadelphia excepted), meaning they don’t give up many goals in any situation.
Down at the bottom of the standings, we see teams that score a lot and teams that have poor defenses. When it comes to W5MGA, the worst team in the league was the high-scoring and poor-defending Buffalo Sabres.
This table provides excellent context. A team will do well in the W5MGA counts if they are good defensively and poor offensively; a team will do poorly if they are good offensively and poor defensively.
More proof that teams’ defense matters can be found by grouping teams based on their defensive prowess. The W5MGA and W5MOPP (opportunities to have a goal scored within five minutes) shown are the group averages.
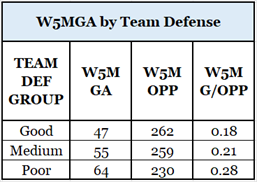
The key information is in the last column: good defensive teams game up 0.18 goals within five minutes of having scored, while poor defensive teams gave up 0.28 goals in that same time period.
W5MGD – Balance
In some statistics, a balanced viewpoint is not necessary. When looking at a team’s powerplay goals you usually ignore the shorthanded goals they gave up, because teams usually give up a trivial number of shorthanded goals.
W5MG merits balance, as we are looking at what happens in five minutes of ice time (from an essentially random starting point). A balanced statistic would consider goals scored and conceded in the five minutes after either team scored. And that balanced statistic would be called W5MGD, which stands for “Within Five Minutes Goal Differential.”
W5MGD will be positive if a team scores more often than their opponents within five minutes of a goal, and it will be negative if a team scores less often than their opponents in the five minutes after an earlier goal. In case it isn’t extremely obvious, the five minutes starts when either team scores.
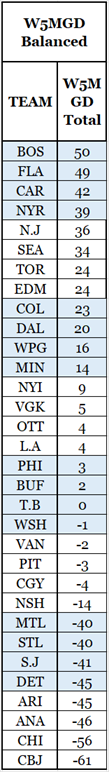
The W5MGD Balanced table has teams in an order that largely agrees with the regular season standings. The better teams have a positive W5MGD and are at the top, while the lesser lights have a negative W5MGD and are at the bottom.
I would normally expect a statistic like this to have a bell-curve shape, where most teams would gather in the centre and a few teams would be at the ends. That isn’t the case here.
At the top of the table, there are six teams at +34 to +50, while at the bottom of the table, there are eight teams between -40 to -61. I believe this is a one-season exception caused by the number of teams having exceptionally good or bad overall goal differentials in 2022-23.
If I calculated this over a number of seasons, which I am not going to do, I am confident the data would be bell-shaped. Trust me on that.
W5MG – Cause or Effect?
Is there a cause-and-effect relationship between W5MG and a team’s standing in the league? If so, what part is the cause and what part is the effect? Does good W5MG data make a team a league leader, or do league leaders naturally have good W5MG data?
To be clear, teams will be considered “good” or “bad” based on standing points.
The first table showed there was no correlation between W5MGA and standing points. However, there is a correlation between W5MGD and standing points. In general, good teams have good W5MGD, and bad teams have bad W5MGD.
Which part is cause and which part is effect? It’s a team’s standing that causes a team to have good W5MGD. Good teams play well all the time, including, but not limited to, the five minutes after a goal has been scored.
Whenever you look at scoring statistics related to a limited time span, it is more than likely that the better teams will have the better statistics. Looking at the ten minutes of play in the middle of the second period, the three best teams in the league in terms of goal differential were Edmonton, Los Angeles, and Toronto. The three worst teams in the league were Columbus, Montreal and Anaheim.
Let me stress this point: teams aren’t good teams because they play well after a goal has been scored, just as teams aren’t good teams because they play well in the middle of the second period. Teams that are good play well in any situation. A very good team will naturally have good W5MGD data.
Summary
The definitions for balance and context were copied from Merriam-Webster.com.
W5MG is a tricky statistic to understand. The broadcast’s colour commentator can be forgiven for not diving into its intricacies because you couldn’t fit all this context and balance into the live play-by-play of a game, especially when Ottawa gave up a goal within seconds of the statistic being displayed.
W5MGA is almost a perfect “commentator statistic.” It looks like it tells us something important about the character of a team: Ottawa doesn’t play well after they score. If you look at the balanced statistic W5MGD, Ottawa is in the middle of the pack. But that goal the Senators gave up 38 seconds after having scored was still painful to Ottawa fans.
Related Articles
None.