
This article originated when I heard some grumbling from the Carolina fanbase about their team this season, and I recalled that they are big on the art of shot suppression. I wondered if they were still suppressing shots.
I had a couple of non-statistical questions I wanted answered first. Who started the shot suppression strategy in Carolina? When did they start it? I really wanted the start date, as the team shots against data should change around then.
To answer the who and when questions, I needed to consult my hockey expert.
According to the Son
My hockey expert is my son, who immerses himself in different aspects of the game than I do. He is more familiar with a broad range of hockey generalities, while I bury myself in a narrow range of the specificities of hockey numbers.
The son said the person who is credited with creating Carolina’s shot suppression strategy is Rod Brind’Amour, who joined the Hurricanes as an assistant coach at the start of the 2011-12 season and became their head coach at the start of the 2018-19 season.
Carolina Shots Against Since 2007-2008
The way to measure a team’s shots against is to look at their shots against data (duh), specifically a statistic called SA60, which is Shots Against per 60 Minutes of ice time. All manpower situations are included, from overtime 3v3 to regulation 5v5 to powerplays to penalty kills.
To provide context for Carolina’s data (shown with a blue line), the league average data (red line) is also shown. The two grey columns in the chart show Brind’Amour’s important Carolina dates: when he joined and when he was the head coach.
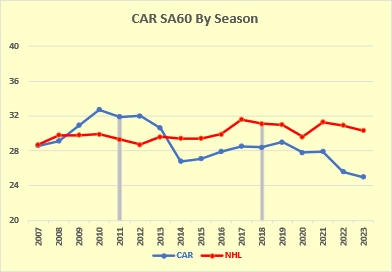
Shot suppression arrived in full in the 2014-15 season. As the son is rarely wrong, I assume that Brind’Amour didn’t introduce the system until 2014-15.
Carolina Shots For Since 2007-2008
Since the data is just sitting there (in my spreadsheet it is in the column to the left of shots-against), I quickly looked at Carolina’s shots-for data. I wondered if the shot suppression of their opponents also resulted in a shot suppression for the Hurricanes. The unit of measurement here is SF60, Shots-For per 60 Minutes of ice time for all manpower situations.
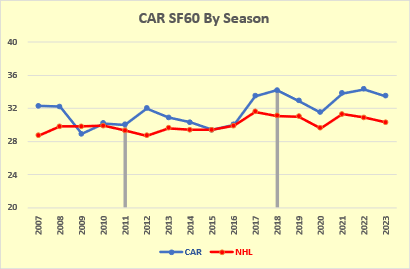
The act of suppressing opponent shots absolutely did not remove the offense from the Hurricanes. Since 2017-18, the Hurricanes have always been above the league average in shots for and below the league average in shots against.
Are the Hurricanes Just Blocking Shots?
Blocked shots at the team level are not directly recorded in NaturalStatTrick.com (my usual source of data). I can derive blocked shots by using Corsi and Fenwick. Corsi counts all shot attempts and Fenwick counts all unblocked shot attempts, so subtracting Fenwick from Corsi produces blocked shots.
I could put up a chart for this, but I’ll save a little ink and just use words. Carolina’s blocked shot rate has had nothing but normal season-to-season variations from 2007-08 through last season, ranging from 13.8 to 16.7 blocked shots per 60 minutes.
The B60 rate for Carolina this season is the highest they have had since 2007-08: 21.2. I checked to see if a new scorekeeper had entered the game, but their blocked shot rate at home is extremely similar to their blocked shot rate on the road: the increase in blocked shots this season is not a scorekeeper preference, it is due to an increase in blocked shots.
To be clear, the tactics used by Carolina to suppress opponent shots have not historically included blocking shots.
Quantity Rather Than Quality?
If the shots that are being suppressed are low-value shots, then the strategy would have little impact on goals conceded. If you eliminate five shots that each have a 1% chance of scoring, over the season you might concede four fewer goals (five such shots per game over 82 games would be a reduction of 410 shots and 4 goals – 1% of 410 is 4).
While several statistics shed light on this, I will use two: expected goals against and shots against (both per 60 minutes).
Dividing expected goals against by shots against tells us the value of the average opponent shot attempt. The following table shows that Carolina has consistently limited their opponents to lower-quality shots than average, except for the last two seasons.
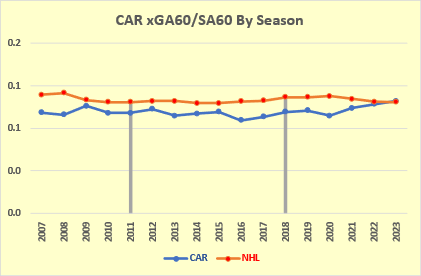
If the Hurricanes were reducing low-value shots, that would mean the remaining shots would have an average that is higher than the league average, and the blue line would be over the red line.
Not only has Carolina historically reduced the quantity of opponent shots, but they have also historically reduced the quality of opponent shots, and at the same time they have increased their number of shots. You can’t ask for much more out of a strategy than that.
Carolina in the 2023-24 Season
There is some dissatisfaction in the Carolina fanbase with their results this season. Looking at their situation from Ottawa it is hard to see what they have to complain about. It seems to be the age-old fanbase issue: the team is not doing as well as it should be doing.
If there is one team that is close to Carolina in terms of shot suppression, it is the Los Angeles Kings. Like the Hurricanes, the Kings have had a history of reducing the shots of their opponents.
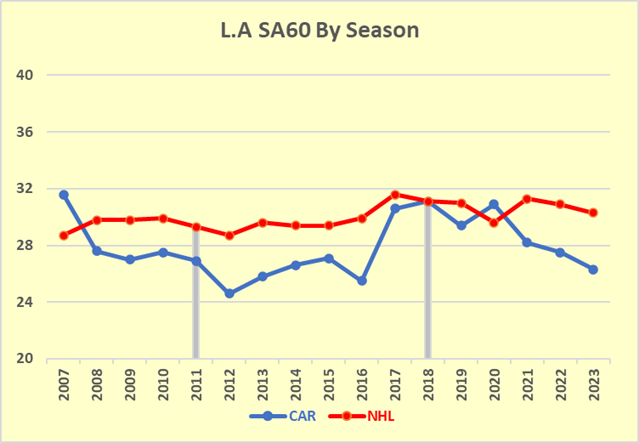
The dry spell from 2017-18 to 2020-21 was down years for the Kings, where they qualified for the playoffs once and played a total of four playoff games.
This season, the SF60 and SA60 for the teams are very similar.
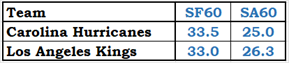
If goals were accurate reflections of shots, we would expect the two teams to have scored and conceded similar numbers of goals. They haven’t.
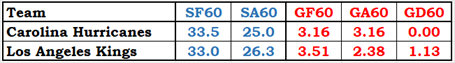
With the biggest shot difference in the league, the Hurricanes are breaking even in scoring. With the second-biggest shot difference in the league, the Kings are scoring 1.13 more goals per 60 minutes than their opponents. As a result of the goal data, the Kings have a much better record than the Hurricanes.
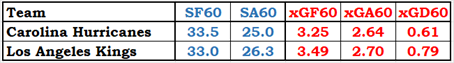
Why are the Hurricanes giving up so many goals this season? It isn’t because of the shot suppression strategy. 2023-24 is one of the Hurricanes best shot-suppression seasons ever.
While I hate to throw any player under the bus (as can be evidenced by my repeatedly not throwing the terrible Ryan Reaves under any number of buses), the problem in Carolina this season is the goaltending.
Their expected goals against are 2.64 (table below): the goalies are giving up 0.52 extra goals per game. That is a huge number of extra goals to give up. Only two teams are worse at giving up goals: Ottawa (-0.53) and Edmonton (-0.62). Neither of those fanbases is pleased with their goaltending.
Based on their shot data, Carolina should be on track for a 105-point season, which would comfortably have them make the playoffs. Instead, they are on track for 93 points, which puts them on the edge of the playoff race. There is reason for concern, but not for panic.
Summary
The data show that the shot suppression strategy is not a shot-blocking strategy, and it is not a reduction-of-low-quality-shots strategy. The Hurricanes give up fewer shots per game than almost any other team, and the quality of those shots is also among the lowest in the league.
The data also show that the Hurricanes are not a defense-only team, as their shots for numbers are among the highest in the league.
Their shot-suppression strategy reduces opponents’ scoring opportunities and increases their scoring opportunities. That’s a hell of a good strategy.
This season, things are working out, and it’s because the goalies are not playing well. As Big Bobby Burns almost said, the best-laid strategies on ice for men often go wrong.
Etymology
The actual quote from Robert Burns is “The best-laid schemes o’ mice an’ men gang aft a-gley.” “Gang aft a-gley” means “go off astray” in Scottish vernacular. It is said when something ends poorly or differently than expected, despite preparations for success.
Most of this section is taken from thefreedictionary.com.
Related Articles
None.