
I came home on the night of February 7th and my son asked me if I had heard the NHL news about hits. I hadn’t. This is what he showed me.
In an article I wrote back in 2022, Correcting Hit Counts, I showed that hit counts were heavily influenced by the rink in which a game was played.
There was an article in The Athletic about the NHL’s statistical update (written by Michael Russo, on February 7, 2024). I will quote from it liberally. Any text in a blue font in this article is a direct quote from The Athletic article.
A Player’s Perspective
Here are some thoughts from Marcus Foligno (MIN) on the change in hits.
“I think it’s good,” said Foligno, his team’s perennial hits leader. “It’s not like you count during games, but there have been times this season where there are three, four that you know that were pretty good ones and then you look at the sheet after and you’ve got like one and are like, ‘Whoa, whoa, whoa. How did they miss those?’ … I’m glad the league’s going back to get it right because it’s a lot of bread and butter for some guys. Especially me.”
I had often wondered whether players paid any attention to hit counts and how they varied from arena to arena. Mr. Foligno has paid attention.
“You see some places, like Long Island, they give away hits like candy. Just look how Clutterbuck or Matt Martin are always up there. You go into those places and you can rack up 10 or 12 if you really want, where other places you have to put somebody through the glass to get a hit.”
The NHL’s Perspective
These quotes come from a message the league sent to the teams, which was quoted in the Athletic article.
“As part of the league’s ongoing effort to provide the most accurate statistical accounting possible of NHL games and to address what appears to have been irregularities in hits recorded by off-ice officials earlier this season, I want to advise you of a two-step process that is being undertaken. Working with our third-party analytics service, an audit of the hits in every game so far this season has been performed.”
The NHL has noticed irregularities in hit counts. The use of the phrase “earlier this season” is interesting, as it limits the scope of the correction work to just this season. As noted in the introduction to the article, hit counts have been irregular for many seasons now.
“Filtering to account for hits that have already been recorded, we are preparing to adjust the hits numbers in every game from the start of the season. Season-long hits statistics and the game reports for each game will be adjusted on Tuesday, Feb. 6….”
The first clause of the first sentence means the NHL will not remove hits that have been recorded, so no player will lose hits as a result of this adjustment. They are basically saying the only problem was undercounting, that no off-ice official recorded hits that were not hits. I think it is very difficult to make a judgment error on just one side of things: there may be a lot of undercounting, but it is inconceivable that there was no overcounting.
Rather than simply adjusting the season-to-date statistics, they will go back and change all game reports. This is appropriate, as many of their data users get data from detailed sources (game-level play-by-play reports) rather than from season-level reports.
“As a result of this process, total hits per game will be increased on average of approximately 8.7 resulting in totals consistent with recent seasons.”
Again, it looks like the NHL thinks that hits were being under-counted just this season, as the adjusted counts will be consistent with recent seasons.
“Going forward, and on a nightly basis, games will continue to be audited with totals adjusted the following morning by approximately 9 a.m. for the remainder of the season.”
It looks like the NHL does not think their off-ice officials can record hits properly.
“We want [the off-ice officials] to do their job, to continue to apply the NHL definition of a hit …. Things work best if everything is captured live, but the game moves very fast. There’s a fair amount of subjectivity. There’s a lot that the off-ice officials are asked to do in a short period of time.”
If the statistics are best “captured live,” did the hit statistics they are adopting get “captured live” as well? That is actually quite likely, as you’ll see in the section titled Third Party.
Stapled to the Bench’s Perspective
Hits are used in the Productivity Rating formula that produces each player’s PR-Score, and so a change in a statistic used at Stapled To The Bench is of interest.
Across all players from 2022-23, hits account for just under 2% of PR-Scores. Hitting is a small portion of PR-Scores because it is, in my opinion, an unimportant event. Hits do not lead to winning, rather losing leads to hits.
While there are players who hit a lot and have high PR-Ratings, the reason they have high PR-Ratings is the other things they do, and not the hits they have. For instance, in 2022-23:
Brady Tkachuk (OTT) had 242 hits and a PR-Score of 9.11 (PR-Star).
Michael Pezzetta (MTL) had 239 hits and a PR-Score of 2.46 (PR-Fringe).
Ryan Reaves, (MIN/NYR in 2022-23, TOR/PressBox/Bench in 2023-24), had 196 hits that contributed to his PR-Score of 2.28 in 2022-23, placing him towards the bottom of the PR-Fringe category. How many extra hits would he have needed to get into the PR-Regular category? He would have needed 1,433 hits, which is more than two extra hits per minute of his ice time.
Stapled to the Bench’s official stance on the NHL’s statistical update is a shoulder shrug. The estimated increase in hits would leave hit’s contribution to PR-Score at slightly under 2%, so there is no worry that Ryan Reaves and Michael Pezzetta will suddenly become highly valued players. It seems a lot of effort for the NHL for an undercounted statistic.
Third-Party
On reading the NHL’s statement, the phrase “third-party” caught my attention. Who are the first two parties? Is there a fourth party? I did some grammatical/technical research.
In the sense of statistics, first-party data are data an organization collects itself. The NHL collects statistics during a game, so their statistics are first-party data.
Second-party data are acquired from a trusted partner. In the NHL, attendance figures can be considered second-party data.
Third-party data are similar to first-party data but are collected by an independent entity. There are companies that produce their own statistics and sell their products to interested parties (NHL teams).
The fourth party will be introduced in the next section.
A Work of Speculative Fiction – How the Changes Were Made
At some point in time, NHL statisticians determined that hit counts this season were irregular. Specifically, they determined that hits must be being undercounted. How does an organization go from this determination to changing statistics for the entire season, including games that have already been played?
Before involving the third-party analytics service, some sort of budget for the process had to be established. The league is run by a cluster of lawyers and businessmen: they were not about to hand a blank cheque to anybody. If the cost of making the fixes now were too high, the league would have continued with the statistics as they were being collected, because almost nobody really cares about hit counts.
If the audit was being done “properly”, the third-party analytical service would not use its own data, as that would be a conflict of interest. They should have used data from a fourth-party supplier. A fourth-party is an independent group that get paid by the third-party, and the third-party would have added the cost of acquiring the fourth-party data in their contract with the first-party.
Exactly how the third-party identified missing hits is unknown to me. If it was me doing this work, I would: 1) identify extra hits in the fourth-party’s data; 2) select a random sample of those extra hits, and; 3) review game footage to evaluate the accuracy of those extra hits. If this review indicated that the extra hits were largely accurate, then it would be a matter of incorporating those extra hits into existing reports.
Note that I didn’t say it was a simple matter. I have a sense that the NHL has a process to regenerate the statistical package for a game, and it obviously would have been used a lot in this correction process.
A Work of Provable Facts – Player Hit Counts
My plan was to get unadjusted hit counts for each player, in both home games and away games, and compare that to the adjusted hit counts. I mostly did just that.
The unadjusted hit counts came from NaturalStatTrick.com. I copied data from that site on the morning of February 7, 2024, first confirming that they hadn’t updated their statistics by checking the hit count for Jeremy Lauzon (NSH). Lauzon’s pre-audit and post-audit hit counts were noted in the Athletic article, and on NaturalStatTrick he had 200 (pre-audit) instead of 229 (post-audit). I got copies of player data for all ice situations, broken down by home games and away games. Two acts of copying gave me the pre-audit data for all players.
I also got hit data from the NHL that same morning, where hit counts had been updated: Lauzon had 229 hits. Due to a personal effort constraint, I didn’t get the NHL data for every player. The NHL site displays a maximum of 100 rows of players’ data, and there are over 800 players so far this season: I’d have to copy player data eighteen times to get a full accounting (home and away games), and I didn’t want to put in quite that level of effort.
After sorting the NHL data by hits (high to low) I copied the top three sets of 100 players. That gave me data from the 300 biggest hitters at home and the 300 biggest hitters on the road. 239 players appeared in both the top 300 at home and on the road and had played for only one team this season. The “one team” requirement allowed me to use player data to get team-level data. It is those 239 players I used to examine who got credited with extra hits, a group that included all the big hitters in the league.
The first table shows the players who are leading the league in hits based on post-audit counts.
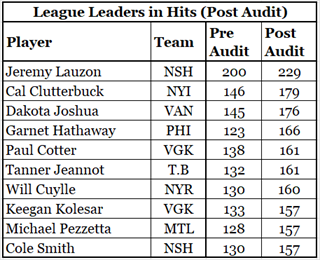
All of these players received at least two dozen extra hits from the audit. Of this group, the player with the fewest number of pre-audit hits was Garnet Hathaway (PHI), and he was fifteenth in the league pre-audit. There are no “secret hitters” in the NHL. No player went from being credited with 70 hits to being credited with 170 hits.
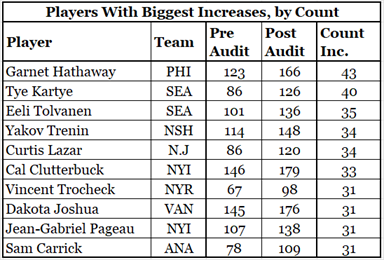
Can anything be learned about hits by looking at the players who had big count increases? Are hits delivered by Curtis Lazar and Vincent Trocheck less physical than those delivered by Garnet Hathaway and Cal Clutterbuck? Or did these players just happen to play in front of off-ice officials who undercounted hits? I tend to think it is the latter.
Finally, here is data from the two teams whose players had the biggest increases in hits at home when measuring the increase percentage: San Jose and Seattle. San Jose led all teams by a considerable margin, making their off-ice officials the biggest under-counter of hits in the league. Seattle was solidly in second place, quite a bit ahead of the third-place team.
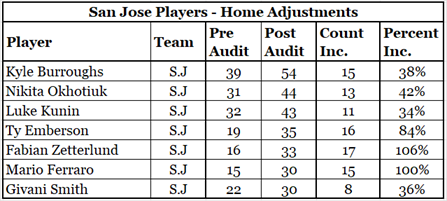
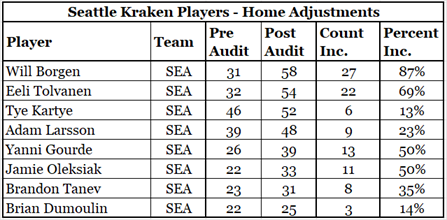
This chart tells us that some players were practically unrecognized as hitters by their hometown off-ice officials. Do these tables tell us anything about the nature of undercounted hits? As I don’t know any of these players from Adam Larsson, they don’t tell me anything.
A(nother) Work of Provable Facts – Team Hit Counts
As noted earlier, team hit counts come from the 239 players who qualified for the player hit count analysis. As such, no team’s hits are fully accounted for, but each team’s hits are about 60% accounted for. As we are dealing with incomplete data, I rated the teams by percentage increase rather than counted increase.
Let’s start with a wall of numbers.
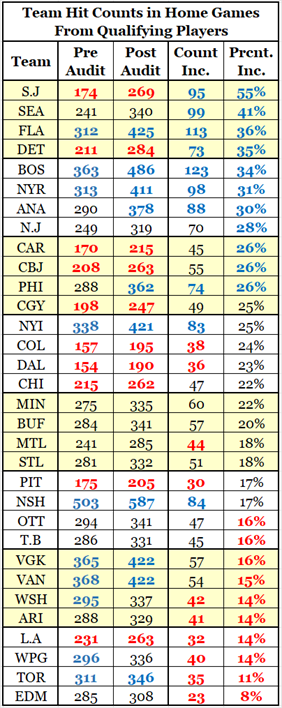
The teams in this table are presented in Percent Increase order, from high to low. As mentioned in the previous section, San Jose and Seattle had the biggest percentage increases in home hit counts.
Toronto and Edmonton had the smallest increase in hit counts. We all know how important hits are to the Maple Leafs, given they signed slightly-slower-than-a-Zamboni Ryan Reaves in the off-season. I’m sure their off-ice officials were brought to a state of awareness of the team’s desire to have hits counted.
You’ll notice numbers in red and blue font. The red numbers indicate the bottom ten teams in a category, while the blue numbers indicate a top ten team. Black numbers represent teams in the middle.
As the table is sorted by Percent Increase, all of the blue numbers are at the top of that column and all of the red numbers are at the bottom. [LDO]
As Percent Increase is based on Count Increase (and Pre-Audit count), most of the blue numbers are at the top and most of the red numbers are at the bottom.
It is fascinating to me that the bottom ten teams in Pre-Audit Home Hit counts are also the bottom ten teams in Post-Audit Home Hit counts. Every red Pre-Audit number is paired with a red Post-Audit number.
Winnipeg and Washington, who were ninth and tenth highest in Pre-Audit counts, dropped out of the top ten in Post-Audit counts, being replaced by Anaheim and Philadelphia.
This tells us a lot about the off-ice officials and how they recorded hits. At the bottom of this table are teams that had the least number of extra hits found in the audit, while the top of the table has teams that had large numbers of extra hits. Hidden in the middle is Nashville, a team that delivers an incredibly high number of hits per game.
Finally, let me put the rightmost two columns of data from that table into a graph. The higher a data point, the more hits were added to the team.
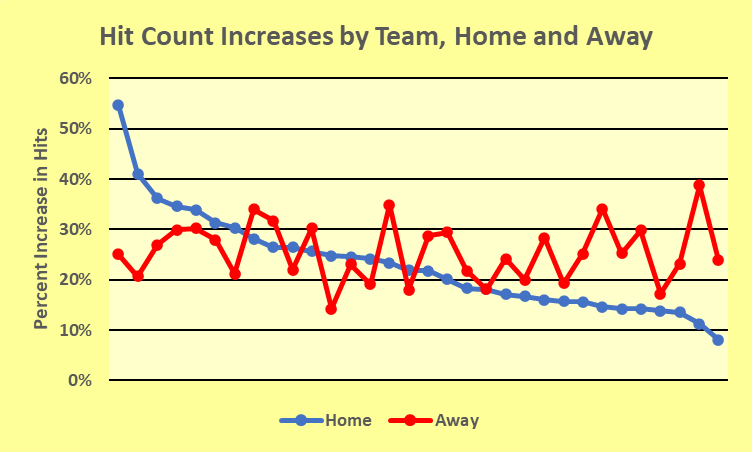
Depending on your sensitivities there are four to seven teams whose home hit counts (blue line) were unusual. The two highest and two lowest are obviously unusual, while the third through fifth highest are at least somewhat questionable.
Where the red data points are high (away games), it is because that team played a lot of games in arenas where the off-ice officials counted the fewest number of hits.
A Player’s Perspective: Sometimes Players Make Mistakes
Let’s look back at Marcus Foligno’s statement regarding hits, focusing on his first sentence.
“You see some places, like Long Island, they give away hits like candy.”
For all of the good insight his comments provided, this one was a bit off the mark looking at 2023-24 data.
If the Islander off-ice officials were handing out hits like candy, then the Islanders would be towards the bottom of the Team Hit Counts in Home Games table, because there would not have been many hits to add. The Islanders are in the middle of the table. Clutterbuck and Martin did not get credited for lots of hits because they played in front of a generous off-ice official in New York: they got credited for lots of hits because they delivered lots of hits.
Sure, But Why?
Changing hit counts mid-season strikes me as a pedantic exercise. In this situation, pedantic means “caring too much about minor details.”
Don’t get me wrong, I’m all for pedantic correctness. Just say the word “utilize” in front of me, and I’ll quickly tell you that you meant to use the word “use.” “Utilize,” I’ll say, “is a word stupid people use to sound smart.” It is no small wonder I have very few friends.
What I don’t understand is why the NHL bothered to correct counts now, mid-season.
Is this correction something that could have been put in place for next season? They could put together a training package for the off-ice officials and let them know the games will be corrected with data from a third-party or fourth-party entity that counts hits properly. Obviously, they would have worded that list a bit more sensitively.
So, why do this mid-season? What was the rush? What problem is being solved, aside from the pedantic issue of the counts being improvable? How does this make the statistics better? How does it increase fan engagement?
Will non-NHL sites like NaturalStatTrick.com update their counts? As of Valentine’s Day, they have not yet updated their counts. Lauzon has 219 hits on NaturalStatTrick.com, while he has 243 hits on NHL.com.
Finally, who in H-E-double-hockey-sticks cares that hit counts were inaccurate?
I hate to produce a bunch of questions without answers, but all I have is questions. I see no reason for this to have been done mid-season.
Summary
It is a fantasy of mine that somebody in the upper reaches of NHL management stumbled on this website, read my Correcting Hit Counts article and said “Holy Sheldon Kannegiesser, our hit counts are wrong. We have to fix things, and we have to do it now!”
In reality, the NHL saw a problem with their data and decided to fix that problem. You have to give them credit for that.
I wonder when they’ll fix their GiveAway and TakeAway counts?
Related Articles
Introduction to Productivity Rating