
This Stapled To The Bench article oncoach Tortorella will focus on statistics rather than the coach’s personality. I don’t particularly care whether the coach is a nice person, I don’t care if he favours defense or offense, I don’t care if he’s right-handed or left-handed. I may check to see if the common perceptions of a coach, (garnered from online, newspapers, radio and TV) are confirmed by the data.
How would the team’s data reflect a coach? A coach who favours a defensive style should reduce a team’s goals against, while an offensive coach will increase a team’s goals for. The data might even show what tactics coaches use to achieve their desired goal.
It is important to note that a change in statistics might have nothing to do with a coach. The Toronto Maple Leafs started having much better seasons in 2016. It wasn’t because their coach at the time got any smarter, it was because 2016 was Auston Matthews’ first season.
Somewhat Close and Almost in Person
I’ve met (as in I’ve been close to) two NHL coaches in my sixty-plus years.
Early in his first run behind the bench with the Senators, Jacques Martin and I had supper together. More correctly, we had supper at the same time. He was at the table next to us in the restaurant. We have never had such good service: the staff were fawning on Mr. Martin, and they had to drop by our table too so it wouldn’t be so obvious.
The other encounter came in early spring 2012. I was on a shift as a marshall at a local golf course. I was asked to bring a golfer from the clubhouse to the nearby hotel, and to do it as fast as I could. I picked up a strapping young man, we drove to the hotel in my golf cart (it was the fastest way), and I dropped him off out front.
The Rangers were playing the Senators in the playoffs at the time. And there was Coach Tortorella, standing by the team bus, waiting for his wayward golfer to show up before leaving for the arena. The young man must have had an interesting day.
As Coach Tortorella is one of my two real-life “encounters” with an NHL coach, as he has coached several teams for multiple seasons, and as he has been hired by the Flyers for the 2022/2023 season, it is fitting that he be the subject of my first article on coaches.
Tortorella’s Style
The common knowledge is that Tortorella wants players who will do anything to win. He wants his team to be hard to play against. He prefers defense to offense. He’d rather lose 3-2 than 6-5.
I’ll go through his head coaching jobs chronologically, starting with his first real head coaching position in Tampa Bay. The statistics for this job are slight, as the first five of his six seasons there were played in the dark ages before detailed statistics were made available.
Tortorella and the Lightning (2001 Through 2007)
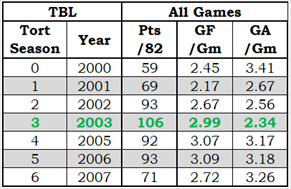
The team table for Tampa is slight; the only statistics that are available are goals for and goals against. Other teams will have bigger team tables.
The first data row in the team table will show the team’s data before Tortorella started coaching them. Since his first full year is “Tort Season 1”, the year before that is “Tort Season 0”.
For Tampa, Tortorella started coaching Tampa half-way through “Tort Season 0”. While he coached 43 games that season, he inherited the previous coach’s team and the previous coach’s problems. It does not count as his first full season.
The turnaround of Tampa in Tortorella’s first three seasons was breathtaking. They increased offense by more than half a goal a game and dropped goals against by almost a full goal per game. They went from 59 points to 106 points. They went from earning early first-round draft picks to winning the Stanley Cup (which is the reason the text for that season is in bold green font).
The turnaround in Tortorella’s last three seasons in Tampa was also breathtaking, but it was the “punch-in-the-gut” type of breathtaking rather than “watching-in-amazement”. Having won the Stanley Cup and then having lost a season to a lockout, on their return the Lightning increased their goals scored by 3% while increasing their goals against by 33%. That’s a bad combination. The players either wouldn’t or couldn’t play Tortorella’s system in 2005/2006.
The collapse was entirely due to defense: the source for this statement is that increase in goals against of 68. The main goaltending pair switched from Khabibulin and Grahame to Grahame and the ancient mariner (38-year-old Sean Burke). Based on save percentage differences, this change cost the Lightning 25 goals or so. The responsibility for the remaining 43 extra goals against must be laid on the skaters and their play: its unlikely Tortorella decided to switch to a run-and-gun style.
In 2006/2007, an almost identical goal record (252-260; 253-261) produced an almost identical standings record (43-33-6; 44-33-5) and identical playoff results (losing in the first round.
In 2007/2008: the offense collapsed and the defense worsened (223-267) and the Lightning plunged down the standings (31-42-9). Coach Tortorella was given a chance to find employment elsewhere.
Tortorella and the Rangers (2009 Through 2012)
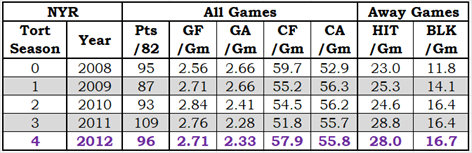
The fifth line in the table above is in bold purple font because it was a lockout-shortened season. Standing points in that row (96) reflects an 82-game schedule (they actually had 56 points in the 48 games played). The table has Corsi information (CF is Corsi For, CA is Corsi Against) as well as hit (HIT) and blocked shot (BLK) data, as that data exists for every season of Tortorella’s time with New York.
Tortorella coached the final 21 games of “Tort Season 0”. As for Tampa Bay, I’m not counting his first partial season as his first full season.
The hit and blocked shot data comes from away games only. I know that home game hit data can be tainted (see the article Correcting Hit Counts), and I suspect blocked shot data is also tainted. Frankly, all “judgement” data is suspect, including Corsi. I found it bothersome to get Corsi data from just a team’s away games, so I reluctantly used full-season Corsi data.
Only one season (2011) during Tortorella’s four-year term with the Rangers was an improvement over the seasons before his arrival.
The first full Tortorella season was a bit of a disappointment. According to Points Based Expectation (see the article for details) process, the Rangers had an expectation of 94 points; they ended up with 87 points.
Tortorella’s second season met expectations: 91 expected points, 93 actual points.
Tortorella’s third season greatly exceeded expectations: 91 expected points, 109 actual points.
Tortorella’s fourth and final season met expectations: 96 expected points, 99 actual points.
Under Tortorella’s tenure, the team increased hits and blocked shots. By the end of the fourth season, hits per game were up 30% and blocked shots per game were up 50%.
Why did the Rangers and Tortorella part ways? The team was still playing pretty well. A Bleacherreport.com article published before his release said “With Tortorella’s personality, it’s not a far leap to think he has worn out his welcome with the Rangers. Players and upper management can only put up with somebody like Tortorella for so long before it becomes too much.”
Yeah, but. He had that personality in Tampa; he would have worn out his welcome with the Lightning players after four seasons in Tampa.
In Tampa, when upper management asked themselves why they should keep Tortorella, the answer was “He just won the Stanley Cup for us.” In New York, the answer would be “Well, he hasn’t won the Stanley Cup for us.”
Tortorella and the Canucks (2013)
As Tortorella only lasted one season in Vancouver, I’m not going to do a two-row team table.
I was very surprised when Tortorella was signed to coach the Canucks, as it wasn’t really his sort of team. I was only mildly surprised that he lasted one year. When the general manager who hired him was fired, and when the team was really struggling, it was very predictable that the new general manager would want to hire his own coach.
And that was one bad season. Vancouver under Tortorella was 40-goals-a-season worse than the season before, and (as it turned out) 40-goals-a-season worse than the season after. Tortorella’s season was the Canucks worst season by far between 2007/2008 and 2015/2016.
The first sentence in the following quote is very pertinent:
A Vancouver Sun article said, “Tortorella’s greatest fault is that his coaching style and beliefs were poorly suited to the players he was hired to guide. Mike Gillis, the general manager who last June gave him a five-year, $10-million contract with ownership’s keen endorsement, is already unemployed. The team owes the coach $8 million. — Tortorella did only what he promised, turning a puck-possession team into a group of shot-blocking, collapse-around-the-net energy players whose leading forwards were expected to eat more ice time than nearly anyone in the NHL.”
The last sentence of that quote is also interesting. The reporter said, “ … whose leading forwards were expected to eat more ice time than nearly anyone in the NHL.” I can check the ice time given to players, and their Productivity Rating can be used to determine if they were leading forwards.
I chose three players to be the leading forwards of the Canucks: Henrik Sedin, Daniel Sedin and Ryan Kesler. Below are their GP and MPG charts, which graphically display how many games they played and how many minutes per game they were given in a season. Games played is represented by thick blue boxes, and minutes per game by thinner yellow boxes. Those thin yellow boxes can show whether those players got more time under Tortorella.
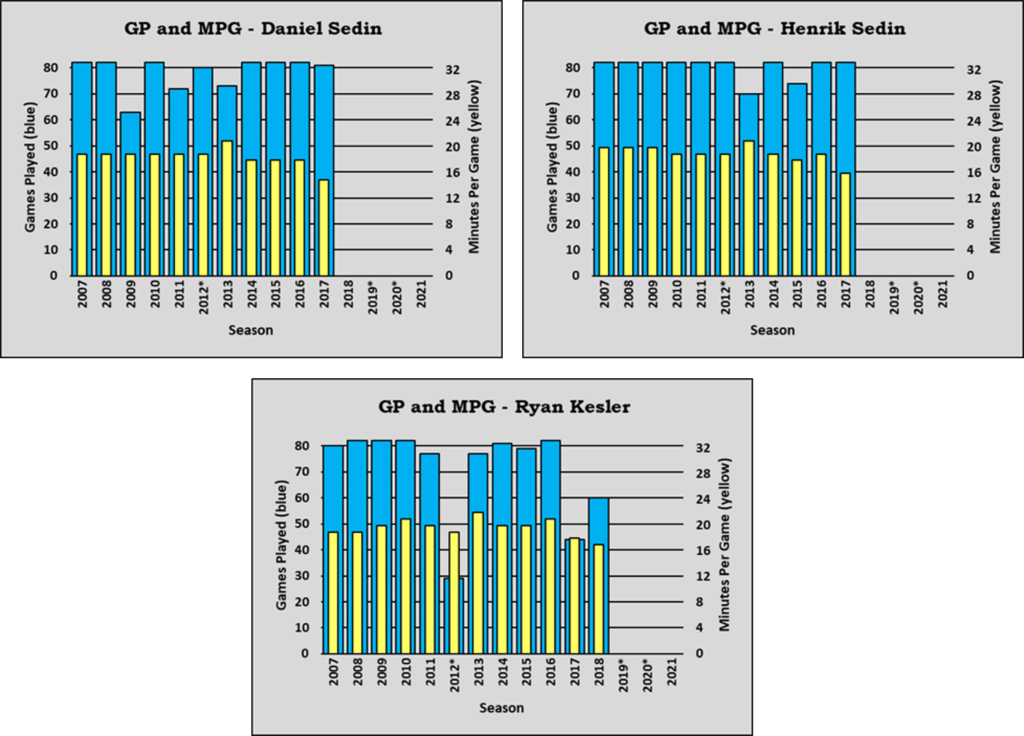
Each of the three forwards had their career high in minutes-per-game in 2013, which was Tortorella’s season. For each of them, the increase in ice time from 2012 was almost entirely penalty kill time. That is counter intuitive. You are going to take your best offensive players and reward them with extra time on the penalty kill? That’ll give them the energy they need late in the game when the team is down a goal.
Sometimes a reporter will make a statement which is at variance with the facts; more often, a reporter’s opinions cannot be fact-checked. In this instance, for this season, for those three forwards, the reporter was 100% correct. Tortorella did have these forwards eat more ice time than almost any forward in the NHL. They were all in the top fifteen in terms of minutes per game amongst forwards.
General Manager Mike Gillis, who had hired Tortorella, was fired towards the end of the season. Trevor Linden was his replacement. A Wikipedia article said that “Gillis and Linden had such a poor relationship that Linden stayed away from the Canucks after retiring as a player.” One wonders if Gillis and Tortorella have similar management styles (abrasive, challenging). And one wonders if by removing Gillis, it made it possible to remove Tortorella. After all, a hard-line GM wouldn’t have an issue with a hard-line coach.
Tortorella and the Blue Jackets (2015 Through 2020)
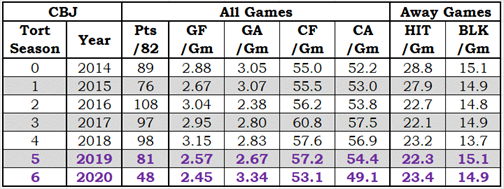
The final two rows in the table above are in bold purple font because they are from pandemic-shortened seasons. Standing points (Pts/82) were adjusted to an 82-game schedule so that the column has the same context in each row.
Tortorella took over Columbus after they had played seven games in 2015/2016, so I’m counting that as his first full season. Yes, it is seven games shy of a full season: sue me.
Tortorella took over a team that was, perceptually, his type of team, a team whose players blocked shots and who were hard to play against (they delivered hits).
In New York, Tortorella inherited a team that averaged 23 hits and 12 blocked shots per away game (23/12), three seasons later they were 29/16. In Columbus, the Blue Jackets were 29/15 in their pre-Tortorella season. From his second season on in Columbus, they were basically a 23/15 team. Why did hits per game drop?
As I’m using the hit and blocked shot data from away games only, the drop has nothing to do with a change of official scorers in Colombus. Maybe it’s the players?
In his first two Colombus seasons (2015 and 2016), the top five hitters included Brandon Dubinsky, Boone Jenner, Scott Hartnell and Nick Foligno. In 2016 David Savard moved into the top five as Fedor Tyutin moved out to Colorado. The top five hitters had 458 hits in the 2015 season, 481 in 2016: an increase of 23. The rest of the team went from 686 hits to 449: a drop of 237.
As happens in any season, some players from the 2015 team didn’t play in Colombus in 2016. Jared Boll went to Anaheim, Rene Bourque went to Colordao, David Clarkson and Gregory Campbell went to seats in an alumni section. Those four players accounted for 141 hits in 2015.
Their playing time didn’t go vacant: it was assigned to other players. The parting four played about 900 minutes total in away games. Three new Blue Jacket players in 2016 played about 900 minutes in away games: Lukas Sedlak, Markus Nutivaara and Scott Harrington. They had 75 hits. Looking at the four parted players and three newcomers who played about the same total minutes we can account for a loss of 66 hits, leaving 171 missing hits.
Did Tortorella assign the task of hitting opponents to a small number of players? Did he say something like, “You five guys hit whatever moves whenever you can, the rest of you hit only when you must?” That doesn’t sound like the sort of thing that Tortorella would say.
Would Tortorella keep players on the team who were hitting less frequently than he wanted them to? That doesn’t sound like the sort of thing that Tortorella would do. He benched star players for one bad shift, so he’d surely bench players who were not hitting enough. The drop in hits in Columbus is an unsolved mystery to me.
As the seasons rolled on in the biggest small town in America (it’s one of the city’s nicknames), Tortorella stayed behind the bench because the Blue Jackets stayed in playoff contention. In his fifth season, the offense dropped by about 50 goals: a huge drop. In his sixth and final season it was the defence that crumbled, allowing about 50 extra goals. The team was 100 goals a season worse from two seasons before. With an impotent offense and a porous defence, Tortorella’s appointment came to an end.
Tortorella and the Flyers (2022 to ????)
Tortorella is taking over a 61-point team. If his pattern continues, in his first season team will do worse. It’s hard to believe they could get much lower than they were last season.
Philadelphia should improve in his second and third season, so maybe they’d be a playoff contender three seasons from now. Remember, they are nowhere near a playoff contender right now; they could win ten more games this season than they did last season and be well out of the playoffs.
If Tortorella had a best-before label on him in Philadelphia, it would read “best before September 2025.”
Goals Per Game by Full Season of Coaching a Team
The chart below shows average goals for and goals against by season, with all data corrected to 82-game seasons. These averages could be based on as few as two teams, so a grain of salt is recommended as you consume the information. PreJT1 refers to the season that was identified as Tortorella’s first full season, while JT1 refers to his first full season. I’m really hoping you can guess what JT2 means.
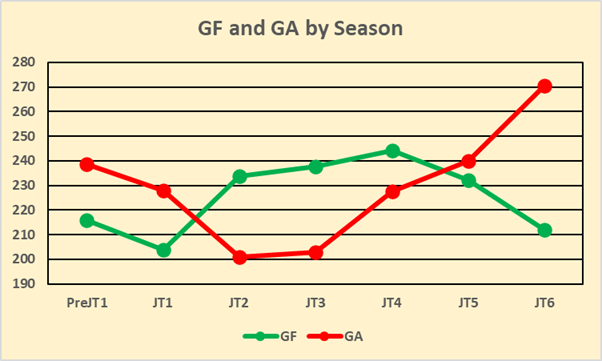
In his first seasons with a team, both offense and defense dropped (by 12 and 11 goals respectively).
His biggest impact on his teams came in his second season. On average, the offense increased 30 goals and the defense improved 27 goals. That’s a massive swing of 57 goals. Using the Pythagoras Points Predictor (hockey subvariant) his teams went from 81 points to 105 points. His third seasons have been very similar to his second seasons. Pythagoras indicates his third season teams were of the 105-point variety.
Teams started to decline in his fourth season. While offense went up 6 goals, the defense gave up 25 more goals. His teams were essentially 97-point teams, which is usually good for a playoff spot, but not with a home-game advantage.
In his fifth seasons, the defensive woes increased, giving up 12 more goals than the fourth season teams. Combined with a drop in offense of 12 goals, JT5 teams were 88-point teams (outside the playoffs).
JT6 teams continued to spiral downward: offense went down by another 20 goals and the teams gave up an extra 30 goals, playing at a 69-point level. That record should get you a top-five draft pick.
Summary
In his three longest coaching assignments (Tampa, the Rangers, Colombus), his teams followed a pattern: slightly down; way up; slightly up; down; way down; more way down.
It looks like his effectiveness vanishes after his third season. Going back to a quote in the New York Rangers section, the loss of effectiveness is consistent with the idea that “players … can only put up with … Tortorella for so long….”
Generally speaking, coaches are hired for good reasons and fired for good reasons. As coaches change the teams they inherited, the needs of those teams change as well.
It could be that when Tortorella changes his teams in those first three seasons, he changes their needs, and his tactics no longer work. It looks like his tactics start to backfire. And then he is fired for a good reason.