
On February 7th, 2024, the NHL announced that it was updating hit counts for the season. They did this “to provide the most accurate statistical accounting possible of NHL games.” I wondered whether they had read my earlier article Correcting Hit Counts, where I showed there was an inconsistency in hit counts.
In this article, I will show that takeaway counts are also inconsistent. The teams whose game statisticians have recorded unusual takeaway statistics, either too high or too low, will be identified. I will also show which players led the league in takeaways in the last three seasons, both by the official statistics and by adjusted statistics which remove the influence of home team game statisticians.
Along the way, I will address two counterarguments that the takeaway data might actually be correct. One is that teams change the way they play at home and the other is that some teams have players that are good at takeaways.
What is a Takeaway?
A takeaway is credited when defensive pressure is applied to a puck carrier which results in him losing possession of the puck: stripping a player of the puck is a takeaway; intercepting a pass is a takeaway; checking a player, when it leads to a change in possession, can also be a takeaway.
A giveaway is credited when a player loses control of the puck, for any reason, without direct defensive pressure. For an example, watch Tim Stutzle (OTT) on a powerplay.
Possession changes due to failed dump-and-chase entries or defensive zone clearances are neither takeaways nor giveaways.
While the criteria for takeaways are straightforward, the devil is in the details. Consider a few seconds of a recent Senators game against Columbus: Columbus had the puck in their defensive zone, then a Senator forechecker had the puck for about a second (winning a battle along the boards), and then the Blue Jackets regained possession.
A game statistician who liberally recognizes takeaways could have given two takeaways on the play, one to each team. A stingy game statistician could have decided neither play merited being called a takeaway, as Ottawa had the puck for barely a second.
Not all game statisticians score similar plays the same way. This season, the Columbus-Ottawa play would probably have been scored as two takeaways had it happened in San Jose or Chicago, and as zero takeaways in Arizona or Vancouver. Had it happened in Los Angeles, I am sure that no takeaways would have been credited.
How can I say that about those teams? I did the analysis before I wrote this article, so it is similar to having read the last pages of a mystery novel.
How This Study Was Done
First, I looked at team-level takeaway data over three seasons (the current season and the two previous seasons). To get team-level counts I had to use player-level data. These data established that there was a discrepancy in the way that takeaways are counted. The data also established the expected ratio between takeaway counts in home and away games.
I then determined more reasonable takeaway counts for players by eliminating the home-team game statistician’s tendencies. I want to strongly stress that this was strictly a mathematical process: I do not have access to game film from every game played these last three seasons. When I say PlayerX has an adjusted takeaway count of 49, I am saying that their real takeaway count is more likely to be closer to 49 than it is to their official count.
I could not do a full in-depth analysis of the game statisticians because I could not see how a specific statistician recorded takeaways from the visiting team’s players (the next section has more information on this). I could not determine if a statistician has a bias in his takeaway counts by over-crediting home-team players with takeaways.
Game Statistics: Takeaways
I wanted team-level counts of takeaways, from all manpower situations, broken down by home and away games, summarized at the season level for each of the last three seasons. As a specific example, I wanted to know how many takeaways the Ottawa Senators had at home and on the road in the 2021-22 season. The answer appeared to be 239 home takeaways and 302 away takeaways.
Did you notice I said, “appeared to be”?
My regular data source, naturalstattrick.com (one heck of a good site for statistics), does not provide team-level hit data in an easily usable season-level format. I can get takeaway data at the player level, so calculations would be needed to get team-level information.
On nhl.com I found team-level home and away counts for takeaways, but only for 5v5 play.
As calculating team-level takeaways from player-level takeaways is easy enough and as I wanted all takeaways instead of just those from 5v5 play, I decided to use naturalstattrick.com data.
Specific Statistics That Were Used
For the current season and the two previous seasons (2023-24, 2022-23, 2021-22) I used NaturalStatTrick’s Individual report, selected all strengths, and split results for multi-team players. I then generated the reports for home games and away games.
As an example of a player’s statistics, in 2021-22 Cale Makar (COL) had 23 takeaways in 955 minutes of play in away games and 26 takeaways in 1021 minutes in home games. Time-on-ice will become important a little later.
By adding the takeaway counts of all Colorado players in 2021-22, the Avalanche had 245 takeaways in away games and 349 in home games, giving them 104 more takeaways at home. Is that unusual?
Let’s look at the data for the teams in the league, starting in 2021-22.
Team Data at the Season Level
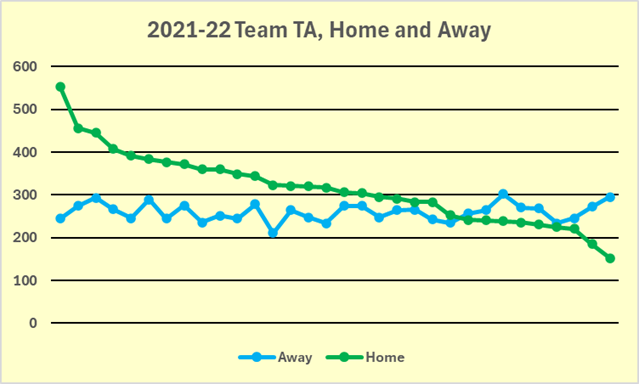
In 2021-22, teams had between 211 and 302 takeaways on the road and between 152 and 553 at home. That chart strongly implies that game statisticians had widely varying interpretations of takeaways. The road takeaway counts, which represent the work of 31 game statisticians, were tightly grouped. Home takeaway counts, which each represent the work of one game statistician, were widely distributed.
A counterargument would be that the data simply reflects changes in the way teams play at home and on the road. That is not remotely reasonable. Why would all high-TA teams at home change their play to be an average-TA team on the road, why would all low-TA teams at home change their play to be an average-TA team on the road, and why would all average-TA teams remain average-TA teams on the road?
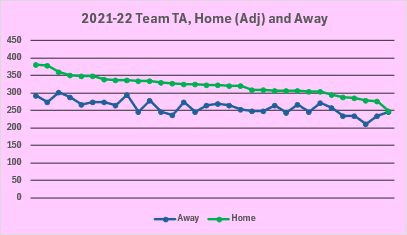
What would the chart look like if all statisticians recorded takeaways in approximately the same way? It would look like the following chart.
Was the 2021-22 data just a one-year aberration? The charts from the next two seasons show inconsistent TA counts are an ongoing trend.
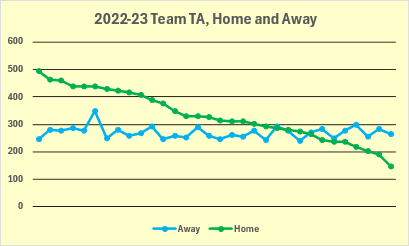
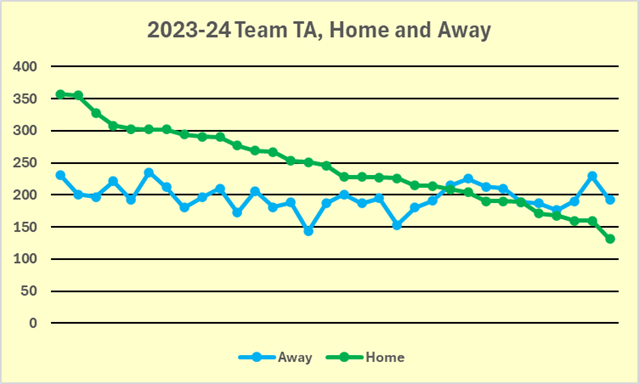
Team names were not displayed on the charts above for two reasons. One is cleanliness: the charts would have been cluttered with team names jammed along the bottom. The other is importance: at this stage of the study, the names of teams are unimportant. I was looking to see if there was an issue with how takeaways are recorded, not (yet) with which game-statisticians were high-counters and which were low-counters.
The three (yellow-coloured) charts show that in each of the last three seasons, there were significant differences in how game statisticians recorded takeaways.
Now was the time to consider individual statisticians/teams. Were the high-takeaway teams the same teams each year? If there is a year-to-year consistency in the inconsistent counts, that would be very strong proof that statisticians are counting takeaways differently.
The Consistency of Inconsistency
The following table groups statisticians by their tendencies to credit takeaways. Statisticians are identified by the team they work for. The table is sorted by the number of times statisticians were in the top ten (ascending) and by the number of times they were in the bottom ten (descending). The table was split in two and placed side-by-side because I don’t like 32-row tables.
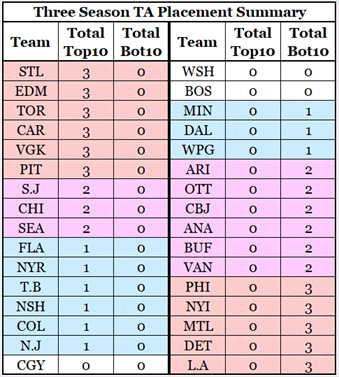
Six statisticians have been in the top ten takeaways in each of the last three seasons. Three others have cracked the top ten twice.
Five statisticians have been in the bottom ten in each of the last three seasons, and six others have been in the bottom ten twice.
No statistician finished in both the top ten and the bottom ten.
What this means is the inconsistencies in counting takeaways are consistent at the statistician level.
A counterargument could be that takeaway data just reflects the players on each team. After all, Vegas had Mark Stone. Carolina had Sebastien Aho. Toronto had Auston Matthews.
Wait, Matthews? Is Matthews a puck-stealing wizard, or is he the beneficiary of a high-TA game statistician? The wisdom of the masses is needed to investigate this counterargument.
The Wisdom of the Masses
What is more likely to correctly reflect the takeaway tendencies of a player? Would it be the one game-statistician in their home games, or the 31 game-statisticians in their road games? If you were going to sell your house, would you want to base your selling price on an estimate from just one real estate agent, or would you want estimates from a couple of real estate agents? I, too, would want to get several estimates of the value of my house before selling it.
Obviously, the combined thoughts of 31 game statisticians must be considered more accurate than the thoughts of one game statistician.
In each season used in this study, 23 of the 32 teams had more takeaways in their home games than in their away games, indicating that home teams do have an advantage in takeaways. The league-level ratio between home and away takeaways at the season level has been very consistent: 1.21, 1.23, and 1.24.
Using data from all 32 statisticians we see that home-team players have about 23% more takeaways than away-team players.
Each player has his takeaways credited by two “groups” of statisticians. One group would be 31 away-game statisticians, while the second group is one home-game statistician.
The wisdom of the masses, in the form of 31 away-team statisticians, gives us a more accurate picture of each player’s takeaway tendencies.
The wisdom of the masses tells us that away-game statistics are a more accurate measure of a player’s takeaway rate and that players playing at home have a 23% higher takeaway rate. These two nuggets of knowledge will be used to adjust each player’s takeaway counts, which can then be used to determine whether the variance in takeaway counts is related to the players on a team. Along the way, the data can also be used to identify the best players in the league at takeaways.
Adjusting a Player’s Home-Game Takeaway Count
Believing in the accuracy of the away-game statistician group (wisdom of the masses), a player’s takeaway count in those games will be accepted as accurate.
A more reliable number for takeaways for a player in his home game can be provided by using his away-game takeaway rate (takeaways per 60 minutes – TA60) multiplied by 1.23, and then using that rate to determine an adjusted takeaway count.
It is, unavoidably, time for an example that shows the formulas. I will use Cale Makar and his 2021-22 data.
In his away games, Makar had 23 takeaways in 955 minutes. His TA60 was 1.45.
In his home games, Makar officially had 26 takeaways in 1021.4 minutes.
His adjusted home takeaway rate is 1.23 times higher than his road takeaway rate: 1.78. Given his time-on-ice, that would make his home takeaway count 30 ( (1.78*1024.1) / 60).
The final wrinkle in my adjustment process recognizes that small differences in takeaway counts are unimportant, as small differences could happen by chance. For this study, I have determined that a “small difference” is five or fewer (three or fewer in 2023-24).
As the difference between Makar’s official and adjusted home takeaway counts is four, which is in the “five or fewer” range, I will use his official home takeaway count. For this study, Makar’s 2021-22 takeaway count will be 49 (23+26).
Another example: Leon Draisaitl (EDM), 2021-22. In away games he had 29 takeaways in 892.9 minutes for a TA60 of 1.95.
In home games, he officially had 45 takeaways in 895.0 minutes. An adjusted home TA60 would be 2.40, which produces 36 takeaways. As the difference between the adjusted takeaway count and the official count is more than five, I will use the adjusted count. For this study, Draisaitl’s 2021-22 takeaway count will be 65 (29+36) rather than 74 (29+45).
Season TA Leaders, Official, and Adjusted
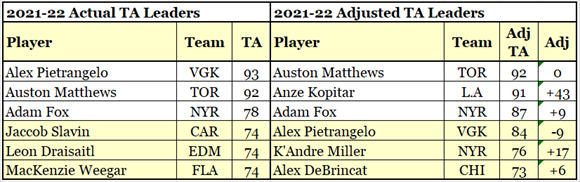
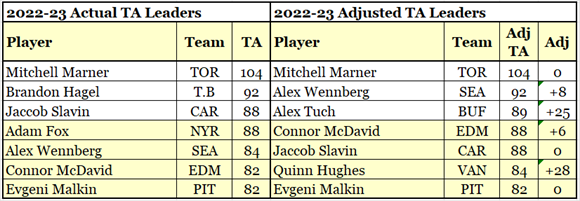
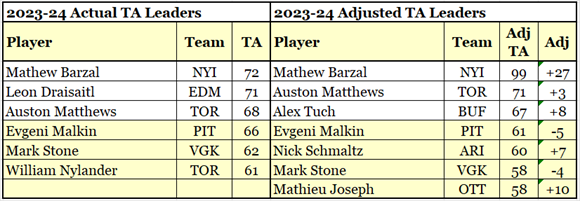
The tables below show takeaway league leaders over the past three seasons. The leftmost columns show the leaders based on official counts, while the right side shows the leaders based on adjusted counts.
Takeaway Leaders Over Three Seasons, Official and Adjusted
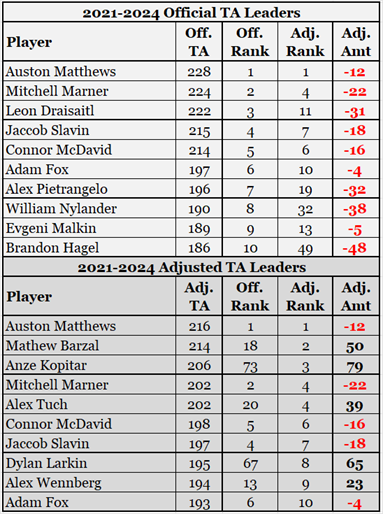
This table shows the top ten takeaway leaders based on total counts over the last three seasons. The official counts are at the top, and adjusted counts are at the bottom.
On looking at the official leaders, many of their names conjure images of offense. Regardless their offensive skill set, these players are quite adept at taking the puck away from their opponents.
All of the official leaders received “help” from their home team statisticians; some received a lot of help. The Adj. Amt column (adjusted amount) shows that all of their counts were adjusted downward in the adjustment process.
There are five different players in the adjusted leaders top ten; two of them are in second and third place.
Barzal’s takeaway count was adjusted upwards by 50; Kopitar’s count went up by 79. Larkin went from 67th on the official list to 8th on the adjusted list because of an increase of 65. These three players had the biggest upward adjustment.
It is these upwardly adjusted numbers that made me wonder: is there a little reverse home-cooking going on? Are statisticians purposefully not counting takeaways by Kopitar, and Barzal, and Larkin to help their teams hide their skills?
I’ve looked at the data and am strongly convinced that there is no reverse home cooking. These players had the biggest adjustments because they played a lot of minutes, they had a high takeaway rate in road games and their home statisticians were stingy at crediting takeaways. While the home statisticians for these players had high standards for crediting takeaways, they used those standards on all players.
The details of that particular side-analysis are not included in this article because I do not want to publish a 20-page article.
A Final Look at Statistician-Level Data
As this article focuses on how takeaways are credited, it is appropriate to end it with a table at the statistician level. The counts are total takeaways, home and away, over the last three seasons. Rows are in descending order of adjusted takeaways.
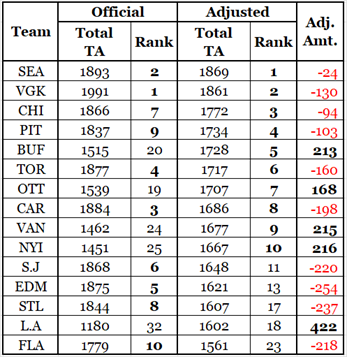
The table on the left shows the top ten teams in both official and adjusted takeaways with one extra team added.
Seattle and Vegas are the top two in both categories, so it is safe to assume that their players have been the most adept at relieving their opponents of the burden of lugging the puck around.
By official counts, San Jose, Edmonton St. Louis, and Florida were all top ten teams. By adjusted TA counts they dropped to 11th, 13th, 17th, and 18th.
Taking their place in the top ten were Buffalo, Ottawa, Vancouver, and the Islanders.
The non-top-ten team included in the table is the Los Angeles Kings. The Kings statistician is the stingiest in the league at assigning takeaways, giving L.A. players a total of 429 while the adjusted count suggests a total of 851. Mark Stone would not like playing for the Kings.
Main Summary
A lot of things happened in this article.
A general tendency of statisticians to have extremely varied criteria for takeaways was shown. A closer look, shown in the Three Season TA Placement Summary table, showed that statisticians were consistent in their inconsistencies (usually high, usually low, usually average). The wisdom of the masses led us to better estimates of player-level takeaways, which then led to a better estimate of team-level takeaways over three seasons.
Along the way, two counterarguments regarding TA inconsistencies were refuted.
It is completely illogical that the data reflects changes in team strategies based on playing at home or on the road, as it suggests that teams have very different strategies in their home rinks while all teams have essentially the same strategy in road games. Why would a team that could have ten takeaways in home games decide to change their style in road games and just have six takeaways? Why would a team that could only manage three takeaways in home games change their style in road games and get six takeaways? Non-sensical.
While some teams had players that get a lot of takeaways, that did not influence the variation in home-game takeaway counts. Teams with players who are good at takeaways but have statisticians who rarely credit takeaways (Los Angeles, New York Islanders, Vancouver) had low official takeaway counts.
Since the NHL decided it would make a mid-season correction to hit counts, and since hits are a nearly meaningless statistic, will the NHL make a mid-season correction to takeaways? After all, the act of taking the puck from an opponent is much more important than hitting an opponent. After all, the NHL loves “to provide the most accurate statistical accounting possible of NHL games.”
Summary Addendum
As this article was being finalized I thought of a way to evaluate whether the statistician in a specific city had count biases based on the colour of a team’s jersey. That is, whether the statistician was giving more favorable counts to home-team players than to visiting-team players.
Related Articles