On the internet, I noticed that the Montreal Canadiens signed defenseman Kaiden Guhle to a six-year contract for $33,300,000. Two questions immediately popped into my head.
Who the heck is Kaiden Guhle? Is this a fair contract?
Is It Embarrassing That I Did Not Know Who Kaiden Guhle Was?
That is a fair question. I write articles about hockey players, and Montreal is a frequent opponent of the Ottawa Senators. You’d think I’d be aware of Montreal’s better players just from listening to the pregame shows on the radio (TSN 1200 – hi, Dean and Gord).
In my defense, there are about 1,000 skaters who play in the NHL each season and Kaiden Guhle is not in the top 200 skaters in the league, based on his 2023-24 PR-Score (PR-Score is a statistic that measures a player’s season, based on more than a dozen NHL statistics). He is one of hundreds of NHL players whose name means nothing to me.
I have no subjective opinion on Kaiden Guhle: I don’t know his hair colour, I don’t know how well he skates, I don’t know whether he is a fan favourite or is good in the locker room. The only things I can use to evaluate the fairness of the contract are objectives. I can use statistics and formulas to determine whether Kaiden Guhle’s contract is a fair one.
A Very Short Biography of Kaiden Guhle
From HockeyDB.com, I learned that his junior play started on the Prince Albert Raiders in the WHL, where he played eight games as a fifteen-year-old. He was sixteen when his Prince Albert team won the WHL championship with a 54-10-4 record.
And then, COVID happened. Prince Albert was doing well in 2019-20 before the season was cancelled. He was drafted by Montreal with the sixteenth overall pick in 2020. The Raider teams of 2020-21 and 2021-22 were not playoff teams. Guhle was traded during the 2021-22 season to the Edmonton Oil Kings, which went on to win the WHL championship.
It is impressive that Guhle was playing in the WHL in his age-15 season. It is impressive that he was part of two WHL championship teams. It is impressive that he played almost no games in the AHL before playing in the NHL (good players don’t spend a lot of time in the minor leagues).
Now, what do his NHL statistics say?
Kaiden Guhle: Productivity Rating
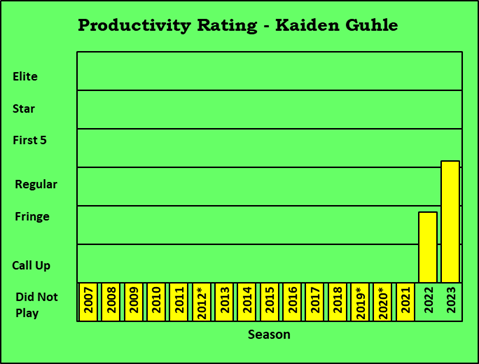
Guhle’s Career Productivity Rating chart isn’t full of information, given he has played so little. What isn’t shown in the chart is that 2023-24 is his age-21 season.
To determine whether Guhle’s $33.3 million contract is fair, it is necessary to estimate the level of his future play. What evidence exists that will give us an idea as to the level of his play over the next six years?
The direct evidence is the statistics he has generated in two years in the NHL. Indirect evidence comes from the statistics of all players from the last seventeen seasons (detailed statistics were first made available in 2007-08). I can look through that wealth of data, searching for players who were very similar to Kaiden Guhle, and see what they did in their following seasons. I can judge Guhle’s future through a jury of his peers.
Finding Peers (Take 1)
Kaiden Guhle’s peers would be players who played the same position at the same age. Since 2007-08, there have been 313 21-year-old defensemen. In terms of productivity (PR-Score), they range from Erik Karlsson (OTT, 2011-12) to Taylor Chorney (EDM, 2008-09, 2 GP).
In a search for peers, I decided to focus on Guhle’s PR-Score. Guhle’s age-21 PR-Score was 6.30, so I decided to look for defensemen who were within 10% of that in their age-21 seasons (PR-Scores between 5.67 and 6.93).
From 313 defensemen, sixteen defensemen emerged.
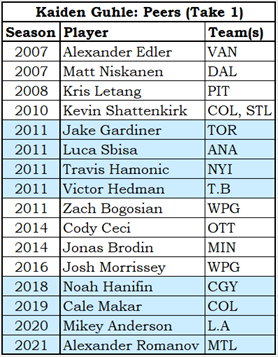
There is quite a lot of difference in this set of players. Some of them are offensive defensemen, others are defensive defensemen.
What is normally a strength of PR, that it measures different types of players with one measurement, is somewhat of a weakness now. There is a difference between players having similar PR-Scores and players being similar.
I had hoped the peer-finding process would be simple. I should have known better.
The Problem with the Simple Approach
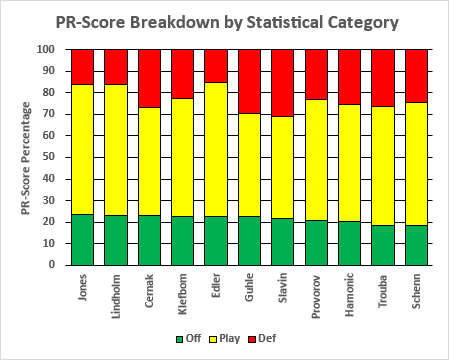
The following chart (PR-Score Breakdown) shows how much offense (green), play (yellow) and defense (red) contributed to their PR-Score. Kaiden Guhle is included (10th column).
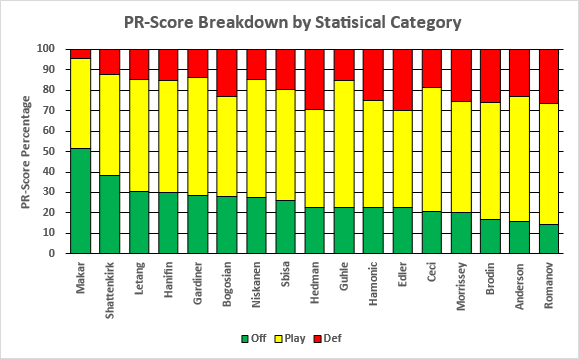
Offensive categories are goals and assists; defensive categories include PK-TOI and blocked shots; all other contributing statistics were lumped into a category called “play”. Players in the chart were sorted from high offense to low offense.
You can see that Guhle is not really similar Makar and Shattenkirk (who were more offense-oriented), and is also not really similar to Brodin, Anderson and Romanov (who were more defense-oriented).
The statistics at hand can be used to refine the search for the peers of Kaiden Guhle. My immediate focus was on Makar and Shattenkirk who are, no offense intended, better defensemen than Guhle.
Finding Peers (Take 2)
Cale Makar played 67 games and had a PR-Score of 6.83: Guhle played 70 games (3 more) and had a PR-Score of 6.30 (0.53 less). Rather than use straight PR-Score, I decided to use PR82, which is a player’s PR-Score per 82 games played. Guhle’s PR82 was 7.39, so the PR82 qualifying zone was 6.65 to 8.13. Makar’s PR82 was 8.36: he is not a peer of Guhle because he was a better player at age 21.
Shattenkirk’s PR82 is 7.59, so he is somewhat surprisingly within the “overall skill range” of Guhle. I calculated each player’s points per 82 games, rounding to a whole number (Pts82). Guhle’s Pts82 was 26, and I set the qualifying zone (+/- 5 points) at 21 to 31. Shattenkirk’s Pts82 was 49: he is not a peer of Guhle because he is a more offensive defenseman.
One final restriction was that a defenseman had to play his age-21 season no later than the 2020-21 season so that he would have at least three seasons of future play.
This new process produced ten close peers for Kaiden Guhle. Only Edler and Hamonic were on the first list.
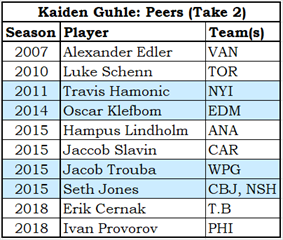
As you can see in the following PR-Score Breakdown chart, this group of defensemen are much more similar to each other. Just look at the size of the green boxes!
While ten players make a small group, I made it even smaller because the Olympics were being televised as this article was being conceived. In judgment sports (such as gymnastics) higher and lower scores from the judges are removed. For this exercise, I am going to jettison the two best and the two worst defensemen from the group of close peers.
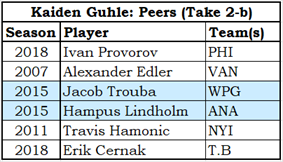
I calculated the weighted average PR-Score of each of these players for their age-22 to age-26 seasons, with their younger-age seasons counting for more. The two best players were Seth Jones and Jaccob Slavin, and the two worst were Luke Schenn and Oscar Klefbom. The remaining six players, the “tight peers” of Kaiden Guhle, are shown below.
Future Productivity Rating
It’s time to look at the PR-Scores of Guhle’s tight peers over the six seasons after their age-21 seasons. The two players who had their age-21 season in 2018 (Provorov, Cernak) have not yet played their age-27 season, so their cells in column PR27 in the table below are empty.

Looking at the average PR-Score of the six players for each season (the bottom row), you will see there is a slight improvement up to age 25. At age 26, both Lindholm and Hamonic had low PR-Scores, as they only played partial seasons (injuries are a bitch).
Players get injured and injuries reduce PR-Scores, but an injury rate of 33% (two of six players) is much too high: 4.5% is the average (see Appendix A – Injury Rate). How can this situation best be handled? I’m going to use a trusted statistical approach and ignore the low PR-Scores. Statistically, those low scores will be considered outliers.
Outliers are an important part of any set of data. Frequently, they tell you something interesting about the data. Here the outliers tell us something we already know when a statistic (PR-Score) is based on counts generated while playing, that statistic will be unusually low if the number of games played is unusually low.
The updated Tight Peers table is below, with the outlier PR-Scores in PR26 removed.

This very small sample (six players, 32 seasons) indicates that Kaiden Guhle’s future PR-Score for the next six seasons could be around 6.8.
Now we come to the $33.3 million question: what is that future worth, in dollars?
Return From Play
Return From Play (RFP) is a Stapled to the Bench statistic that has been largely used in the evaluation of draft classes. Its concept is that a player’s level of play can be presented as a dollar value rather than as a Productivity Rating score. RFP is perfectly suited to this article, as it puts a dollar value on a player’s level of play.
A small technicality is that I had to update the RFP values I had because they were based on a salary cap of $82 million, while the current salary cap is $88 million.
The RFP of a PR-Score 6.8 season under a salary cap of $88 million is $5.25 million. Guhle’s contract covers six years: six times $5.25 million is $31.5 million.
Is Kaiden Guhle’s Contract a Fair One?
This is an eminently fair contract. Montreal is paying an appropriate price for Guhle’s future, and Guhle is getting fair value for his future. If anything, Guhle is being slightly overpaid. Should the salary cap increase by 2% per season over the course of this contract, Montreal would be getting a slight bargain from it.
Summary
I was pleased that this process (using the future value of a peer group and RFP) produced a dollar value that was close to the contract’s value. It is an indication that RFP produces a realistic value for players.
I wonder how many NHL teams have computerized systems that estimate a player’s future?
Some people decry a computerized approach, saying that numbers cannot possibly fully define a player and that humans do a better job. These people love the hockey knowledge that is lodged in the minds of ancient scouts and elderly general managers, and they don’t want to lose these colourful people. After all, the scouts have had a hard enough time in recent years, not being allowed to smoke their stogies indoors.
If I’ve learned one thing from writing these articles, it is that statistics do not fully describe any player. That is where my agreement with the anti-science crowd ends. Teams that use systems aren’t replacing humans with computers, they are adding computer-generated information to the opinions of their team. If I were a general manager, I would want to know both what the objective analysis says and what the fedora-clad scouts say.
While writing this article, two other articles popped into my head. Both are related to the contract value of players. The first article will look at the future value of players based on their value (VR-Score) at a certain age, while the second article will look at the six-year contract value for players with a VR-Score after the 2023-24 season.
Appendix A – Injury Rate
In the Future Productivity Rating section, I said that an injury rate of 4.5% was the average. That statement needed to be justified, and since the justification takes more than two lines I put it in an Appendix. In this Appendix, specifically.
To calculate the injury rate, I looked for defensemen who were younger than 27 in the first of two consecutive seasons and who played at least one game in each of the two consecutive seasons. While this means I will not categorize a player as injured when he missed an entire season due to his injury, it also means that I won’t count as injured players who retired and players who lost their spot on the team. Players who miss an entire season due to injury are very rare, so the 1-game minimum requirement is justified.
I further winnowed players who were rated PR-Regular or better in the first season. PR-Fringe and PR-CallUp players who don’t play regularly in a subsequent season are more likely to lose their spot on the team due to better players coming along, so the skill-level requirement is justified. A related winnowing effort was to include only players who played at least 75 games in the first of the two consecutive seasons. I wanted the first-season players to be healthy.
Players who played less than half a season in the second consecutive season were considered injured. While it is certain that some of those “injured” players could have lost games for reasons other than injuries, it is safe to assume the vast majority of them were injured.
There were 713 defensemen who qualified (age 27 or younger in the first season, PR-Regular or better, at least 75 games played). 32 of the 713 defensemen played less than half the schedule in their subsequent season: that is an injury rate of 4.49%, which rounds to 4.5%.
For defensemen aged 28 or more in their first season, the injury rate was 6.7%. This shows that players are more easily injured as they age, something we instinctively know.
For forwards, the injury rate for younger players is 3.8%, while it is 4.9% for older players. This shows that defensemen are more likely to be injured than are forwards, another thing we instinctively knew. It confirms that older players are more easily injured.
Related Articles
Introduction to Productivity Rating
The Value of a Draft Pick (where you will find more information on RFP)
Future Value of Players, Updated
Six-Year Contracts
