
You have to love the passion of fans, especially when it comes to their favourite player. A text message was read as the afternoon show on TSN 1200 was wrapping up (2025 Feb. 25). The texter said he knew that Ottawa was going to lose their previous game because of all the line switching that had happened in the game’s first five minutes.
Specifically, he was annoyed that Gaudette had started with Stutzle but was moved off his line. In the texter’s opinion, Gaudette needed to be paired with Stutzle as Gaudette is “the best defensive forward on the team.” The host said something about knowing how big a fan of Gaudette the texter was; you could almost hear him shaking his head in skepticism.
I doubted that Gaudette was Ottawa’s best defensive forward, so I thought I’d look at the statistics and figure out who was. As I started, I had to admit that I could be wrong and the texter could be right. The goal of any research like this isn’t to prove that one person’s opinion is wrong or right; it is to prove what the right answer is.
Forwards Used
To verify that the results for Ottawa were correct, I decided to use all of the forwards in the league. A key part of the subjective verification that the objective numbers identify the best defensive forwards is seeing the results for all teams. The league-level information should provide confidence that the process works.
To qualify for evaluation as a defensive forward, a forward must have played at least 400.0 minutes at 5v5 this season in games played up to February 25, 2025. There were 356 players.
Statistics Used
Only 5v5 data is used. Powerplay data would unfairly make a player look like a defensive stud, and penalty kill data would make him look like a liability. 3v3 data would make it look like a basketball game broke out.
By default, Stapled To The Bench uses count statistics instead of rate statistics. Gaudette’s count of goals against is eleven, while his rate of goals against is 1.29 per 60 minutes of ice time. It is far more important to use rates instead of counts for this study. Low numbers of goals against is mostly caused by low ice time, while low rates of goals against is more descriptive of a player’s defensive abilities.
Goals Against Per 60 Minutes (GA60)
Ten seconds into the analysis, it looks like the texter may have used data to support his position, as shown in the following table.
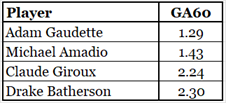
I take longer than ten seconds to conclude data, especially when there is doubt in the first thing I look at. Most fans of the Senators would accept that Amadio and Giroux could be good defensively, but they’d scoff at the idea of Drake Batherson being one of the best defensive forwards on the team.
There is a much better statistic to use to determine a forward’s defensive strength.
Expected Goals Against Per 60 Minutes (xGA60)
A player’s defensive play is better measured by expected goals against, which estimates how many goals should have been scored based on the quantity and quality of shots that were taken while the player was on the ice.
The forward’s defensive job is to reduce the quality and quantity of shots the opposition takes. Successful defensive forwards will have low xGA60. The goalie’s job is to stop the shots the forwards and defensemen haven’t stopped, so the goalie is completely responsible for GA60. Or, more correctly, the goalie is responsible for the difference between GA60 and xGA60.
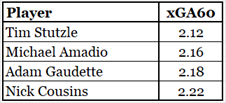
Based on xGA60 data, Adam Gaudette is the third-best defensive forward on the team, trailing Stutzle and Michael Amadio. Both GA60 and xGA60 have Gaudette in the top three of Ottawa’s defensive forwards, yet doubt lingers in my mind, especially because Stutzle is now shown as Ottawa’s best defensive forward.
Is there more data that can be used?
Defensive Zone Faceoffs (DZF%)
Knowing a player’s role on a team is very important in evaluating his defensive skills. Defensive players are put on the ice for a lot of defensive zone faceoffs, and that will increase their xGA60 data. If you lose a faceoff in the defensive zone, your opponents get a shot.
Players who get a lot of offensive zone starts have a natural 150-foot-long defensive buffer. You may not get a shot if you lose an offensive zone faceoff, but the opposition is also unlikely to get one immediately.
Forwards were put into one of five groups, based on how frequently they were on the ice for defensive zone faceoffs (less than 24% of the time, around 28% of the time, around 32%, around 36% and 40% or more).
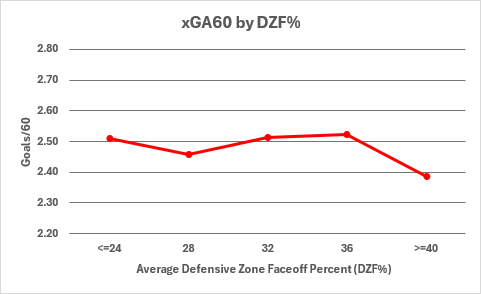
I can guess what you are thinking. The chart shows that players who are on the ice for defensive zone faceoffs for at least 40% of their faceoffs have the best xGA60 data. Logically, the line should go from the lower-left corner to the upper-right corner: the more frequently you are involved in defensive zone faceoffs, the higher your xGA60 should be.
To see whether there was any validity that faceoff locations mattered, I added xGF60 to the chart.
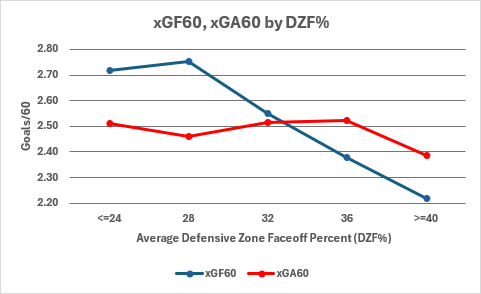
The blue line is shaped almost exactly as would be expected, oving from top-left to bottom right (the opposite of xGA60). The one potentially confusing datum on the xGF60 line is the top left dot, where offensive output declined.
Before I created the charts of expected goal data, I expected the two lines would have made an X-shape. The non-X shape of these two lines is very informative: it tells us that coaches know the difference between their offensive and defensive players and that most players with high offensive skills do not have great defensive skills.
Offensive forwards are put on the ice for offensive zone faceoffs but are a defensive liability if the faceoff is lost. That’s why the xGA60 data is fairly level in all situations, as there are weak defensive players on the ice for offensive zone faceoffs and good defensive players on the ice for defensive zone faceoffs.
The leftmost blue dot is lower than expected because the team in their defensive zone will tend to put their best defensive forwards and best defensive defensemen on the ice. A five-man defensive unit is slightly more effective than a five-man offensive unit, as defensemen don’t contribute as much to offense as do forwards.
Incorporating Faceoff Location Data
I estimated an idealized xGA60 value for each of the five groups of players, based on the xGF60 values and ignoring the drop off at the top left. The statistic is called xGA60Val.
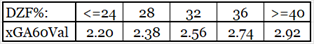
To evaluate a player, I compared his xGA60 to his situation’s xGA60Val, producing a statistic called xGAR60, which stands for “expected goals against reduced per 60 minutes of ice time (with respect to a player’s role).” Here are the xGAR60 results of the four Ottawa players with the best xGA60 data. DZFGrp identifies what group a forward is in based on his DZF%; it has values of 24, 28, 32, 36 and 40.
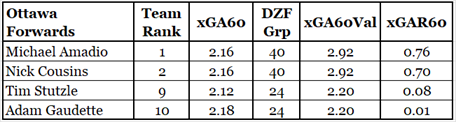
Stutzle and Gaudette have good xGA60 data, but that is an illusion caused by them having almost twice as many offensive zone faceoffs as defensive zone faceoffs. They are not great defensive players: they are adequate defensive players (xGAR60 near 0.00). That is why less than 25% of their faceoffs are in the defensive zone.
I am quite confident that this approach does a good job of positioning players on the defensive spectrum on their teams.
Highest and Lowest Ranked Defensive Forwards on Every Team
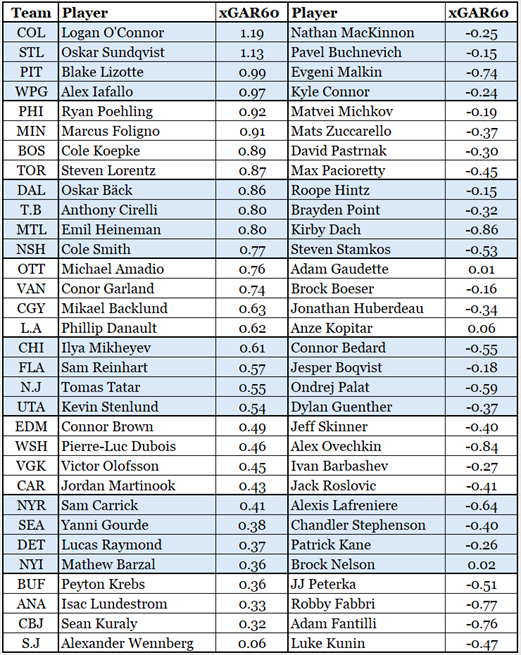
The following table shows each team’s best and worst defensive players according to xGAR60. The table entries are sorted by xGAR60 of the best defensive players (left hand side of the table).
Highest and Lowest Ranked Defensive Forwards in The League
The data used to rank players on a team, xGAR60, does not work to rank players across the league. An adjustment must be made for the defensive strength of a player’s team.
I won’t go into the details of those calculations in this article: it’ll save a page. The league-level ranking statistic is called xGAR60.TA, where “.TA” stands for “team adjusted.” Players on teams with a low GA60 had their xGAR60 adjusted downward, while players on teams with high GA60 had their xGAR60 adjusted upward. Players who played on multiple teams were dropped: I didn’t want to be bothered with the math necessary to calculate their adjusted xGAR60 across multiple teams. This reduced the number of forwards being evaluated for league level ranking to 338.
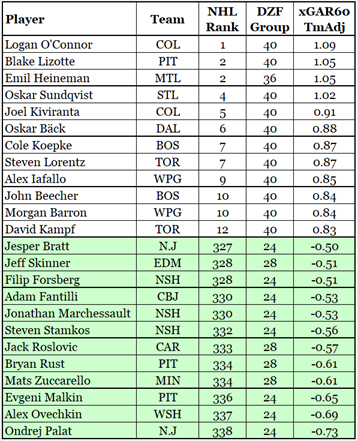
This table shows the twelve highest and lowest-rated players in xGAR60.TA.
The players’ DZF Group confirms that the coaches know who their defensive forwards are. The good defensive forwards are on the ice for lots of defensive zone faceoffs, and those who are defensive liabilities are kept away from defensive zone faceoffs.
While it may be hard for casual fans of the game to determine the accuracy of the list based on the top twelve, the bottom of the list will help them out.
Ovechkin and Malkin are two of the three lowest-ranked defensive forwards in the league. Stamkos is in the bottom twelve. Bryan Rust, who moves as fast as any Zamboni, is in the bottom twelve. At the very least, one should conclude that the process identifies the least defensive forwards!
I am willing to take the leap and conclude the process does a very good job of quantifying all forwards defensively, and crown Logan O’Connor as the best defensive forward in the league. This season. So far.
Summary
With respect to the texter’s comment that led to this article, it is safe to say that the texter is not a statistician (not that I am either, by the way). I assume he made an effort to use statistics, and I appreciate his attempt.
His only problem was a lack of thoroughness. He probably looked at Gaudette’s GA60 number, saw how low it was, remembered that his favourite player was Gaudette, and finished his research. “Gaudette is Ottawa’s best defensive player because of his GA60! I can get my text sent before the end of the radio show!!”
That is sometimes what happens when you do your own research: you get incorrect results, but at least it only took a couple of seconds to do your research.
Through the course of my research, where I admittedly took much more time than I imagine the texter took, Gaudette went from being Ottawa’s best defensive forward (GA60) to their third-best defensive forward (xGA60) to their 10th best defensive forward (xGAR60), out of ten Ottawa forwards that played enough to qualify for evaluation. Gaudette is Ottawa’s least effective defensive forward.
If the texter and I were characters on Star Trek, I’d be Spock, and the texter would be Dr. McCoy. Spock is logical and thorough; McCoy is driven by emotion. I can hear the texter in my mind: “dammit Jim, I’m a texter, not a statistician.”
I don’t know why I imagine him calling me Jim. That’s not my name.
Related Articles
None