
I wanted to identify defensive players using NHL statistics. Defense is largely a team activity, while NHL game statistics are player-based and action-based. Game statistics tell us who took a shot, who made a save, who took a penalty, and who won a face-off.
I could certainly find players whose presence on the ice led to a decrease in shot attempts by their opponents, which sounds like defence. Problem is, many of those players were high scorers. They weren’t reducing the opponent’s offense by playing defense, they were reducing the opponent’s offense by playing offense.
There are three statistics that can be used to evaluate players on their defensive abilities: hits, blocked shots and takeaways. In this article I will describe how the three statistics will be used to evaluate a player’s “disruptiveness” and will identify the most disruptive players.
The summary section for this article will be unusually long, as I will go into depth on some details. Including those details in the main body of the article would obscure the results.
Some Notes About the Statistics
Firstly, only statistics from 5 on 5 play will be used to calculate a player’s disruptiveness.
Secondly, only statistics from a player’s away games will be used.
Thirdly, in order to ensure a good amount of data is available, players will be evaluated using data from three consecutive seasons.
Fourthly, in order to ensure reasonable data is available, only players who meet a minimum time-on-ice requirement over those three seasons will be evaluated. One-game wonders need not apply.
I wanted to get to seventhly, but I ran out of things to note.
With regards to the second point: as noted in an earlier article (Correcting Hit Counts), official scorers interpret on-ice events in unique manners. A few pass out hits like nickels (Tampa Bay, Pittsburgh, Vegas, Chicago), a few others pass out hits like they were manhole covers (Buffalo, Calgary, Minnesota, Dallas). By using away games, all players will be measured by very similar measuring sticks.
Disruptive Play is a Trait
I see disruption as a player trait, or characteristic. This raises the question of how disruption should be measured in order to determine which players are most disruptive. If counts are used, then players with the most ice time will have an advantage. Allow me to illustrate this issue with two examples.
Jacob Trouba delivered 207 hits in 2021/2022, while Mark Borowiecki delivered 196. Trouba delivered more hits (count) but Borowiecki was the more frequent hitter (trait). Trouba’s hits came in 1,816 minutes of play, while Boro-cop got his hits in 748 minutes. Per 60 minutes of play, Borowiecki out-hit Trouba 15.7 to 6.8.
The top three scorers in the NHL last season were Connor McDavid at 123 points, followed by Johnny Hockey Gaudreau and Jonathan Huberdeau with 115 points each (counts). In terms of points scored per 82 games played (trait), the top three were Connor McDavid (126), Nikita Kucherov (120) and Auston Matthews (119). Kucherov finished 51st in scoring in the regular season, having played just 47 games. When he is healthy, Kucherov is one of the top offensive threats in the league.
Borowiecki is a more frequent hitter, based on hits per 60 minutes of play. Kucherov is an extremely dangerous offensive threat, based on points per 82 games played. To measure disruption, a time-unit rating is required.
Measuring Disruption
We need a disruption score and a time frame to create a “disruption index.”
The disruption score is not simply the sum of the three statistics. That would be like counting the coins people had in their pockets to determine who had the most change. A person with two loonies (two coins) has more change than a person with twelve dimes and two nickels (fourteen coins).
Each statistic needs a weight that indicates how valuable it is with respect to the other statistics. We will start with the least valuable statistic: hits.
At the team level, hits delivered is the only statistical category where the team which has the most in a game tends to lose the game (see the article Team Results List). Hits do not always result in a change of control of the puck, as sometimes the puck has already been passed when a hit is recorded. Hits get a weight of one.
Blocked shots prevent a shot attempt from becoming a shot, but they do not always result in a change of control of the puck. Blocked shots get a weight of four. Do I really think that a blocked shots is four times more important than a hit? No: I am doing hits a favour.
Takeaways absolutely result in a change of control of the puck, which is very valuable. Takeaways get a weight of six.
Adding the weighted sums of takeaways (T), hits (H) and blocked shots (B) produces a player’s THB-Score, a measure of his total disruptiveness. As an example, in 101 away games since 2019 Auston Matthews (TOR) had 84 takeaways, 61 hits and 76 blocked shots. That makes his THB-Score 869 (6*84 + 1*61 +4*76). The higher a player’s THB-Score is, the more disruptive the player has been.
The time unit being used for disruption will be 60 minutes of 5v5 ice time. Players will be ranked based on their THB-Score per 60 minutes, a statistic that will be called Disruption Index (DX). Auston Matthews had 1,642 minutes of ice time, so his DX is 31.8.
As with THB-Score, the higher DX is the more disruptive the player is. A value above 30.0 should put a player into the top 10% of disruption.
Disruption Index – Categories?
My default preference for the statistics I create is to have both the statistic itself and a set of categories. Productivity Rating (PR) has both PR-Score (a number such as 5.7726) and PR-Category (5.7726 would be in the PR-Regular category).
There are two issues which make it hard to create categories for Disruption Index.
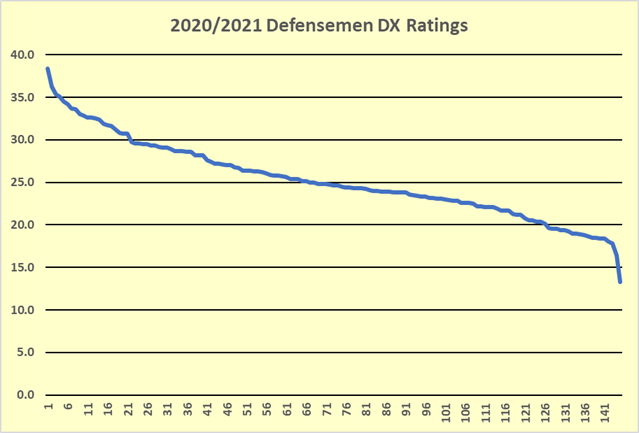
Problem number one is that there is no obvious place to identify category boundaries. The following chart shows the DX Ratings for all qualified defensemen from most disruptive to Keith Yandle.
Problem number two is the names of the categories. I could not find a set of words that meaningfully describe degrees of disruption. Is vexatious more than irksome? Could I use interruptive? Does obstreperous work? (No: it means noisy, clamorous or boisterous, as in obstreperous children.)
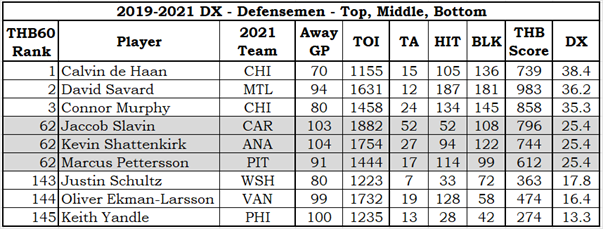
With meaningful words unavailable, letter grades are the next best option. With obvious category boundaries unavailable, practical boundaries are the next best option.
The most disruptive players will have a DX-Grade of A (DX-A), while the least disruptive players will be DX-D. Players in different grades could be close in DX-Score (25.2, 24.8) or could be far apart (29.7, 20.3). This is just what used to happen in school. An A-student and a B-student could be close (91, 88) or far apart (96, 82) in their average grade scores.
Disruptive Defensemen
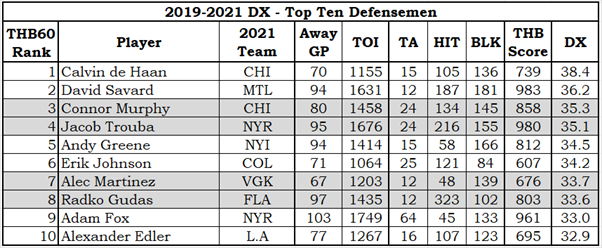
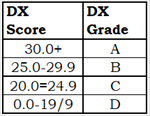
Calvin Haan is the most disruptive defenseman in the league. While David Savard had more hits and blocked shots, it took him 476 more minutes of ice time to generate those counts.
145 defensemen met the time requirements for DX. They averaged 22.8 takeaways, 105.6 hits and 99.0 blocked shots. The average defenseman DX was 25.3.
In order to show the span of disruptiveness amongst the defensemen, the following table shows three middle-ranked players and the three bottom ranked players along with the top three. No defenseman had a DX of 25.3, but three were at 25.4. Those three defensemen were equally disruptive in different ways.
Disruptive Forwards
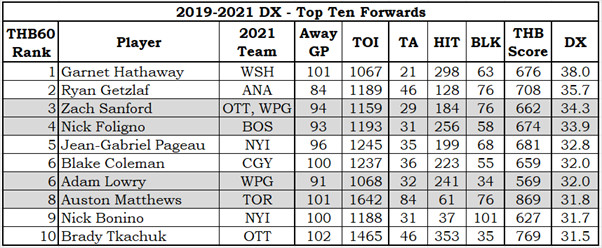
The surprise is Auston Matthews. My opinion of Matthews was that he was an offensive player. The data shows that dude plays defense and plays it well. He was first among forwards in total takeaways and tied for third in blocked shots.
The 196 qualifying forwards averaged 34.2 takeaways, 89.7 hits and 34.2 blocked shots, leading to an average DX of 21.4.
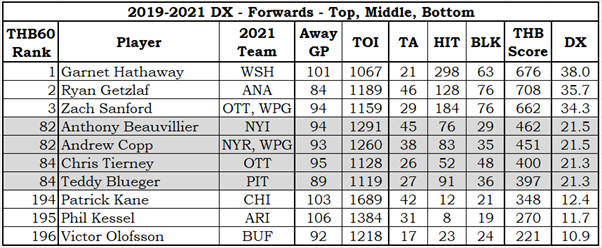
Kessel has been at or near the bottom of the forwards’ disruption rankings since the 2012/2013 season. Yandle, currently the lowest rated defenseman, has been at the bottom of the defensemen’s rankings since 2014/2015. You can’t play 1,000 straight games if you get an injury because of blocking a shot or delivering a hit! And if you aren’t close enough to an opponent to deliver a hit, you aren’t close enough to take the puck away either.
Summary
This was an interesting and time-consuming study to do, taking several weeks. Playing with NHL statistics is not the only thing I do in a week, it is just a hobby. Every now and then I get some time to work on articles, and sometimes those instances are far apart. Especially when home renovations are happening!
Weights Used for Statistics
The weights assigned to the statistics (1 for hits, 4 for blocked shots, 6 for takeaways) were selected before the data was gathered. When doing these sorts of studies, it is important to make decisions like that before seeing the results. I want to see what the data tells me rather than use the data to support my beliefs. I would only change the weights if the results were “wildly incorrect.”
It is my impression that heavy-hitters are over-represented at the top of the list. Maybe I was expecting the top would be occupied by players who did all three actions a lot but my dissatisfaction with the structure of the list does not mean the results are wildly incorrect. It might mean the type of player I expected to find at the top does not exist, or it might mean that my dislike of goonish hockey overly-influences my thinking.
“Not to my liking” is nothing like “wildly incorrect.” For the list to be wildly incorrect, players like Phil Kessel or Chris Teirney would have to have been highly ranked.
Time-Played Criterion for Evaluation
When the result of calculations is a rate or a percentage, it is very important that the calculation only be done for players who have a good amount of data. Every year, there are players who win 100% of the faceoffs they take. They are far from the best faceoff artists, as they rarely take more than three faceoffs in the entire season. The best faceoff artists win three faceoffs in a period.
DX was only calculated for players who had at least 10 minutes of 5v5 time per away game over a three-year period. DX is a measurement of offensive disruption in 5v5 play, and should only be calculated for players who get 5v5 ice time. The 10-minute criterion eliminated some big-hitting fourth-line forwards from consideration, a result with which I am comfortable. It also eliminated call-ups who played well in a couple of games. Not only am I comfortable with that, I meant to do it.
Another part of the time criterion was that a player had to record at least 25% of the minimum ice time for the three-season span in the last season of that span, so as to avoid assigning a disruption factor to a player who had retired.
Defensemen and Forwards
Defensemen block a lot more shots than forwards, and forwards have a lot more takeaways than defensemen. The two groups generate DX differently. Defensemen tend to have higher disruption scores than forwards.
Player-Level Consistency
DX calculations were done on all qualifying players for all possible seasons. Those results were not presented in this article because it would make this article hella long.
I looked at the results of several players who have enjoyed long careers and can say that players’ DX numbers are quite consistent from season to season. One example is Zdeno Chara, who has been playing hockey since ice was invented.
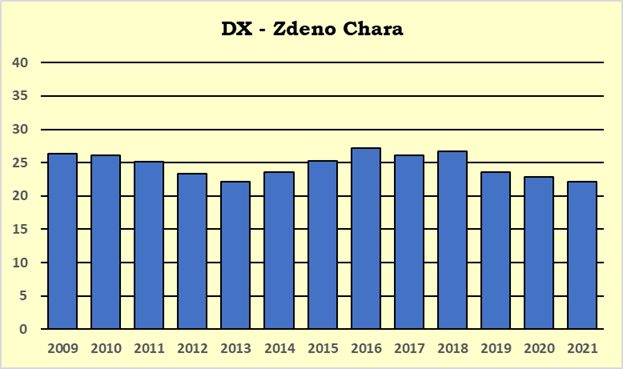
Chara’s DX bounced between 22 and 27 throughout his career. The dip towards the end of his career is probably caused by aging. Technically, his takeaway and blocked-shot rates went down after the 2017/2018 season while his hit rate increased.
Ryan McDonagh’s chart below shows the effects of a probable change in play.
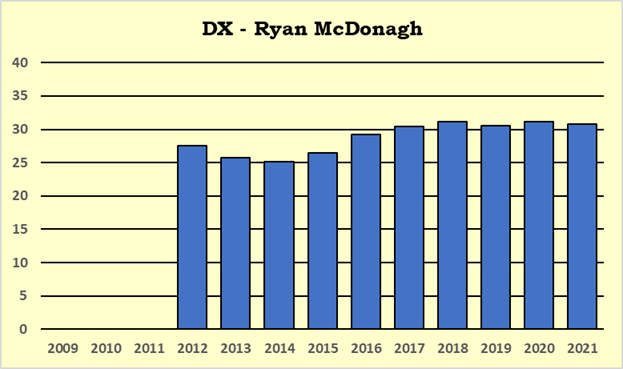
In the 2015/2016 season, McDonagh increased his blocked shot rate by 10% (from 4.4 blocks per 60 minutes to 4.8). From the start of his career to the end of 2014/2015, he averaged 4.3 blocks per 60 minutes; since the start of 2015/2016, he has averaged 5.0 blocks per 60 minutes.
When there is a significant fluctuation in a player’s DX, it is caused by a change in the way he plays. From what I have seen, s change in playing style usually coincides with an injury. In order to continue playing when an injury prevents him from playing as he used to, the player comes up with a new way to play.
Team Level Disruption
Disruption Index can be calculated for teams. In fact, as each season has so much team-level data it is possible to calculate team DX for individual seasons.
In 2021, the most disruptive teams to play against were Ottawa (28.3) and San Jose (28.2), while the least disruptive teams were Buffalo (21.5) and Edmonton (21.4).
I wondered if DX would show how a coach might have influenced the style of play for his team. A coach named Tortorella, for instance.
Context: At the team level, a difference of 3.0 in DX is significant. In 2021, the New York Rangers were 5th in the league at 25.4, while St. Louis was 26th at 22.5.
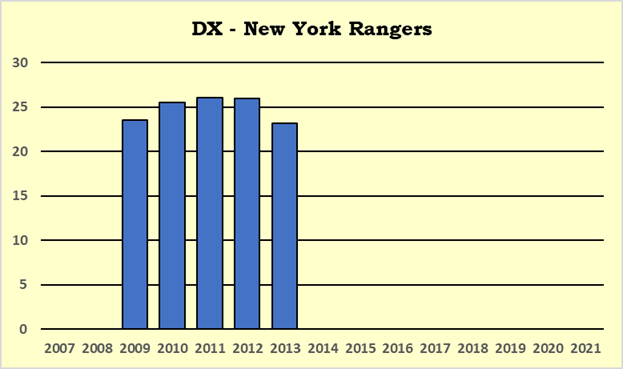
With the New York Rangers, where he coached full time between 2009/2010 through 2012/2013, DX indicates he had an impact on the team, turning them into a team that was much more disruptive. By the 2010/2011 season (2011 in the chart above), the Rangers had increased their DX by 2.9 since the end of the 2007/2008 season. By 2012/2013, they had returned to their pre-Tortorella level of disruption.
Tortorella coached in Columbus from 2015/2016 through 2020/2021. He started with a team that was about as disruptive as he would have liked. He started with his type of team.
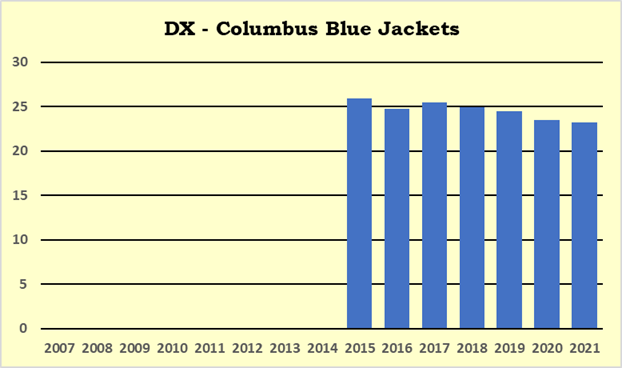
DX in Columbus started declining in the 2018/2019 season (2019 in the chart).
In both New York and Columbus, it was reported that he had “lost the room”. Players had stopped playing hard for him. I want to stress right now that I am not a hockey insider. I do not have access to hockey information above and beyond what can be found in the local press and in the statistics.
I am not stating that “Tortorella lost the room”, but I am saying that the DX measures show what “losing the room” looks like for a coach like Tortorella.
Seasonal variations at the team level could happen for reasons other than coach’s hard-ass attitude. Players come and go. Players get older. Players get injured. If a team lost one high-DX player to free agency and another to injury, it is extremely likely that the team’s DX would go down.
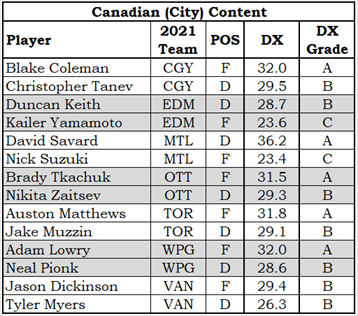
Canadian Disruptors
When I talked to a friend about this article, he asked me who was the most disruptive player on Montreal. He’s a fan of the Habs, and I am not, so I had no idea.
I decided to solve this problem at a national level by putting together a list of most disruptive players (one forward, one defenseman) on their Canadian-based teams. The surprises for me were Matthews in Toronto (still a surprise) and the much-maligned Zaitsev from Ottawa.
Summary of Summary
It has taken a large amount of time to write this article. The length of the summary shows one of the reasons: I kept getting distracted on “side” issues.
Is DX consistent for a player across seasons? Yes. Can DX be used to compare forwards and defensemen equally? Yes, but defensemen generally have higher DX. Does DX work for teams? Yes.
I had to write some nice things about Auston Matthews, who plays for the wrong team. In writing this article I was reminded that one cannot be a fair analyst of the game and a fan of a specific team at the same time. I do not like the Leafs, but that doesn’t matter: Auston Matthews is one of the top ten offense-disrupting forwards in the league. The data have spoken.