
Every now and then during a hockey broadcast you’ll hear the colour commentator say something like “Detroit is 16-1-2 when Dylan Larkin scores.” It is a statement that sounds impressive, and it is exactly the sort of thing we expect colour commentators to say. It is my opinion that this statement is a “dumb thing heard on the radio” (DTHOTR).
The statement comes with an implication that Detroit was 16-1-2 in those games because Larkin scored. While it is probably true that many of Larkin’s goals were key to victories, surely some of his goals came in games Detroit won by a large margin, where his goals were more icing-on-the-cake than key-to-victory.
In an earlier article called Who Scores The Important Goals, I evaluated players based on how the goals they scored in 2022-23 changed the state of the game when the goal was scored. That data set has all the data I need for this article: who scored, the outcome of a game, as well as the original article’s data.
Who the Heck is Big Bobby Clobber
Big Bobby Clobber was the invention of Canadian comedian David Broadfoot. Bobby had taken a few too many shots to the head and wasn’t the sharpest skate in the rink to begin with. Bobby is fondly remembered as being the main reason for the mandatory helmet rule.
Bobby could be considered the Canadian version of Cauliflower McPugg, the punch-drunk boxer portrayed by Red Skelton.
Data Source
The data for this study is play-by-play data for the 2022-23 season, which I purchased from BigDataBall.com (BDB).
In preparing this article I noticed that BDB data did not perfectly line up with NHL data. A player in BDB would be shown as having 32 goals, while the NHL.com site would show him with 31 or 33. My usual source for player data, NaturalStatTrick.com (NST), had no differences with the NHL. The players used in this article scored a total of 602 goals (BDB), and the total of all discrepancies is four goals.
Four discrepancies: either BDB has a couple of mistakes in its data, or I made mistakes counting the goal scorers in the BDB data. While you’d think it is more likely that I would make an error, I strongly doubt that I did. I used formulas to get the counts from the BDB data, and if I made a mistake in my formula, counts would be off all over the place and the total discrepancy in counts would be much higher than four – more like four thousand. And not to be slinging mud, but I did find a couple of other errors in BDB data.
Obviously, I would prefer that the data being used were perfect. But they are at least 99.2% accurate, which is “perfectly” acceptable. I have used data that is way less than 99.2% accurate for other Stapled To The Bench articles. For example, I have written a couple of articles on hits, and I think the hit count in NHL statistics has been about 80% accurate.
Players Being Examined: 29 to 35 Goals Scored
One of the things that makes the record-when-Bobby-scores statement dumb is that it is presented without context. What was Detroit’s record in games where David Perron (24 goals) scored? What was New Jersey’s record in games where Jesper Bratt (32 goals) scored?
I will provide the context of team records when a player who scored 32-ish goals scored because Larkin scored 32 goals in 2022-23. Players who scored 29 to 35 goals will be used in the first stage of this study.
To be perfectly clear, I am using forwards who scored 29 to 35 goals while playing on only one team last season. Restricting the players to those who played for one team thing made it miles easier to determine team records when the given player didn’t score in a game.
The following table shows the players, their team, their games played, their goals scored and their team’s record both when the player scored and when they didn’t score. Team records will be shown in win-loss format, so Larkin’s current 16-1-2 record will be shown as 16-3. Players will be presented in descending order of their team’s winning percentage when they scored (for example, Tampa Bay won 80% of the games in which Hagel scored). Several items of interest will be discussed after the table.
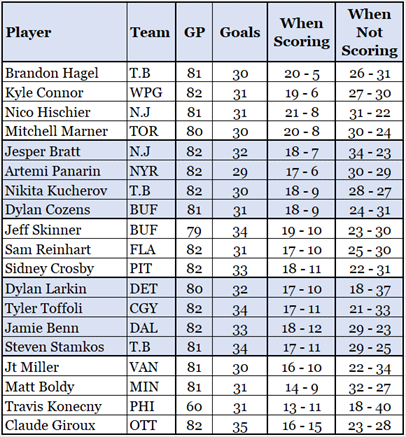
While not obvious in any way, the average record of the teams these players played for is 43-39, a little above .500. A team that has a 30-goal scorer is generally an above-average team.
Every player’s team had a better record when the player scored than when he didn’t.
Dylan Larkin, the exemplar for this article, is at the top of the second shaded section of players. Larkin had some multi-goal games, so he scored in ‘only’ 27 games. Detroit was 17-10 when he scored, 18-37 when he didn’t score. Obviously, Detroit had much better results when Larkin scored than when he didn’t.
Dylan’s 17-10 record was as close to the average for this group (17½-9½) as one could be. Many players were in the ‘average’ neighbourhood. Fourteen players had 16 to 19 wins, thirteen players had 8 to 11 losses, and nine players had both 16 to 19 wins and 8 to 11 losses.
These 19 players played almost every game their teams played: Konecny missed 22 games, the other 18 players missed a total of 13 games. It isn’t easy to score 32-ish goals and miss a lot of games. Team records “when not scoring” include games in which the player in question did not play.
These data show me that Dylan Larkin is not some magic bringer-of-victory when he scores a goal in a game. His team had about the same record as the teams of the other players in this group. That his team’s record this year is so good is not a sign that Larkin has a special talent; it is just luck. If Larkin was playing in a poker tournament, he’d have been dealt pocket Aces this tournament more often than usual.
Players Being Examined: 19 to 25 Goals Scored
I wondered if the 32-ish goals scored were important to this evaluation, so I looked at players who scored 22-ish goals (19 to 25, specifically). As you should expect, there were more players in this range: 52 in total. Patrik Laine (CBJ) is one of the 52, having scored 22 goals. He will be the exemplar for this slightly less offensively talented group.
I’m going to compare these two groups of players by examining average team records in terms of 82 games played, which makes comparisons easier across the groups.
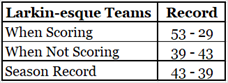
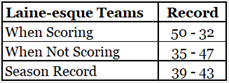
Both groups of teams did better when the selected players scored. The Laine-esque records were a little worse than the Larkin-esque teams because the criterion for selecting a player for that group was lower by ten goals. Anaheim, not a good team in 2022-23, had no Larkin-esque scorers and four Laine-esque scorers.
While every team in the Larkin-esque group had a better record when their player scored than when he did not score, six of the 52 teams in the Laine-esque group had worse records when their player scored than when he didn’t. That’s a small issue, caused by random outcomes for a small set of games (so it is caused by luck, if you will).
Scoring Important Goals
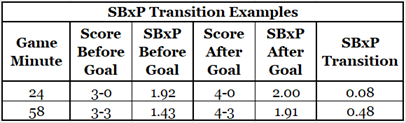
Let’s look at the fourth goal scored for the winning team in a 4-3 victory. In the first game, a player scored with two minutes left to break a 3-3 tie. In the second game, a player scored four minutes into the second period to make the score 4-0 before his team conceded three goals. I contend that the first player scored an important goal while the second player scored a trivial goal. I also contend that you would agree with me: if you were a fan of that team, you’d have been far more excited in the first game when that fourth goal was scored.
In my earlier article Who Scores The Important Goals I said that goals that had a significant impact on a game at the moment they were scored are important goals.
Goals were assigned an importance value based on SBxP, which stands for Score-Based Expected Points. SBxP is a measure of how many points a team with a certain lead at a certain time in the game is likely to get. Scoring a goal changes the SBxP of both teams, and the goal scorer is assigned the “transition value” to the team of his goal. I think this will be much clearer with a couple of examples. The next table shows the transition values of the two goals described in this section’s first paragraph.
The following table shows the nineteen Larkin-esque players, sorted by Total Transition Value of the goals they scored. That value is shown in the sixth column.
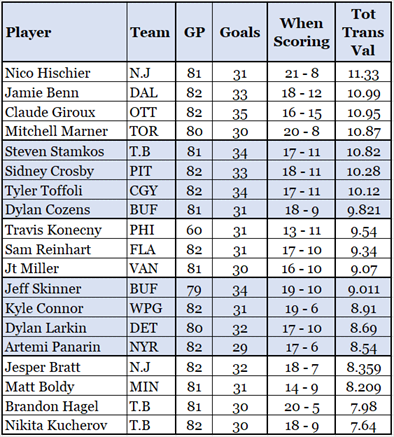
Claude Giroux, who was at the bottom of the earlier version of this table, is in third place here. The Senators just didn’t do great in the games in which he scored: such is luck.
An “important goal” is a goal that has an SBxP transition value of at least 0.40. Giroux had 11 important goals, Larkin had 6 and Brandon Hagel had 4. Tampa Bay wasn’t winning games because Hagel scored, Hagel scored in games that Tampa Bay was (already) winning.
As a complete aside: the King of Empty Net Goals, Alex Ovechkin (WAS), had 42 goals in 2022-23 and only 3 of them were important.
Another Way to Throw Math at This
It should be obvious that a team’s record would be better when a specific player scores.
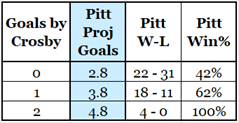
In 2022-23, Pittsburgh scored 3.20 goals per game (262/82) and Sidney Crosby scored 0.40 goals per game (33/82). Pittsburgh’s average score was 0.40 from Crosby plus 2.80 from everybody else.
If Crosby didn’t score in a game, Pittsburgh would project to have 2.80 goals per game. If he scored one, the Penguins would project to have 3.80 goals per game. And, obviously, Sid scoring twice would give the Penguins a projected 4.80 goals per game.
The more goals a team scores in a game, the more likely they are to win it. In the following table you will see Pittsburgh’s projected goals per game based on how many goals Crosby scored, along with their actual win-loss record and actual win percentage in those games.
Taking this to extremes, a team is more likely to win if a low-scoring player scores, as that would significantly increase a team’s projected goals scored.
Summary
Stating a team’s record “when a specific player scores” is a dumb thing to hear on the radio.
The team records for players who scored a similar number of goals to Larkin were remarkably similar to Detroit’s record when Larkin scored. The differences between players in the group are largely attributable to luck.
Related Articles