
While working on an article about each team’s best steal at the draft (Biggest Draft Steals by Team), I wondered what were the best years that teams have had at the draft. Here’s what I found.
Analytical Details
Here at Stapled to the Bench, drafted players are evaluated based on their play over the six seasons immediately following the draft. For that reason, the last draft which can be evaluated is that of 2017. The statistics required to do this analysis are available from the 2007-08 season, so the first draft that can be evaluated is 2007. In total, that’s eleven draft classes.
For each team in each draft, I will calculate the number of skaters they selected, the total investment in those skaters, and the total Return From Play (RFP) of those skaters. A team’s investment cost in a pick and a skater’s RFP are dollar values: they are explained in The Value of a Draft Pick.
RFP is based on Productivity Rating (PR), which cannot be used on goalies. For that reason, goalies will not be included in this analysis. Teams will not be “charged” for their investments in goalies.
This analysis looks at the skaters a team drafted, paying no attention to whether the player stayed with the team. I am looking at how well teams identified talent, not at how well a team retained that talent. Adam Fox’s (NYR) RFP is credited to Calgary, the team that drafted him, even though he never played a single game for them.
A Player-Level Example of Draft Investment and RFP
For example, I will use the first player selected in the 2007 draft: Patrick Kane (CHI). The team investment for a number 1 (or number 2) draft pick is $27,899,000.
Kane played immediately and played well, as his Career Productivity Rating chart shows, with two PR-Star and four PR-First5 seasons.
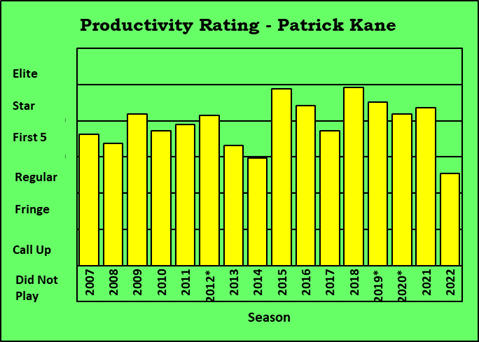
For draft-analysis purposes, only those first six seasons matter. His two slump seasons, which were his seventh and eighth seasons, don’t count. His ninth through fifteenth season, when he played his best, also doesn’t count.
His return from play in those first six post-draft seasons is $34,960,000, meaning his production was a bit above what you would expect from a #1 pick. Chicago made a good investment with this pick.
Five Best Drafts
To set the stage, let me show you the five best drafts that teams have had since 2007.
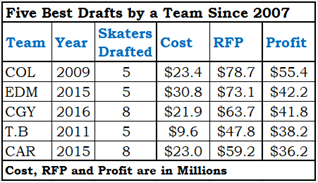
Colorado’s outstanding picks in 2009 were Matt Duchene (pick #3), Ryan O’Reilly (#33), and Tyson Barrie (#64). Each of these players provided a profit of more than $10 million.
In 2015, Edmonton drafted Connor McDavid (#1), Ethan Bear (#124) and John Marino (#154). While McDavid provided the bulk of the profit, Edmonton wouldn’t be on the list without the payback from Bear and Marino. And while the entire world expected more of McDavid than a typical #1 draft pick (an amazing thing, when you think about it), that does not change Edmonton’s investment cost. The formula does not make allowances for press clippings and prognostications.
One year later, Calgary drafted Adam Fox and Matthew Tkachuk. They got six full seasons of play from Tkachuk but didn’t even get six seconds of play from Fox. As noted earlier, they correctly identified Fox’s talent. Before the draft, Fox was ranked 50th for North American skaters by the NHL Central Scouting Bureau, and Calgary got him with the 66th pick.
Tampa Bay’s draftees of 2011 featured Nikita Kucherov (54) and Ondrej Palat (208). Palat was selected with one of the last picks in the draft, and put up statistics that would have been expected had he been drafted with the 4th pick.
In 2015, Carolina picked Sebastian Aho with the 35th pick. Aho’s RFP for his first six seasons is slightly higher than Patrick Kane’s, and Kane was a good #1 pick. Sebastian Aho’s profit (RFP – Investment) is the highest of any player drafted between 2007 and 2017.
2015 is featured twice in the table above: it is the best draft class between 2007 and 2017. It featured Connor MacDavid and Sebastian Aho, as well as Ivan Provorov, Mitchell Marner, Mathew Barzal, Kyle Connor, and Miko Rantanen.
Each Team’s Best Draft Year
Teams will be presented in alphabetical order in two sets of columns, making it easier for you to find your team(s) of interest. Included in each team’s information is the rank their best draft year had in the 326 draft years: Toronto’s best draft year was the 28th best draft year in the last eleven years.
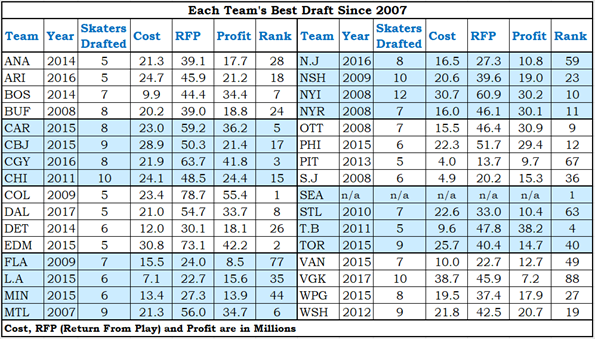
In my Best Draft Classes article the classes of 2015 and 2008 were the two highest rated, and those classes loom large in the table above. Nine teams had their best draft in 2015 and five others had their best draft in 2008.
Pittsburgh’s best draft result came in 2013. Of the five skaters they drafted, only one made it to the NHL: Jake Guentzel was selected with the 77th pick. Generally, Pittsburgh did not do well in the draft between 2007 and 2017. Their better draft picks come from the dark ages (Malkin was drafted in 2004, Crosby in 2005) before the invention of detailed statistics.
Ottawa’s best draft year was not the year they got Mark Stone. It was the year they got Erik Karlsson. And Zack Smith. And Patrick Wiercioch. Yes, Wiercioch: he played better than expected for a player drafted #42.
Best and Worst Teams at Drafting Since 2007
This next table shows the six best and the six worst teams at drafting, as it makes for a much smaller table. Eighteen teams were left off because they were in the middle, while Vegas and Seattle were excused because they hadn’t been at the draft often enough.
The three columns on the right need a little explanation. If a team “made a profit” of more than $10 million from a draft, that was a good draft. If they lost $8 million or more, it was a bad draft. If they were between a $10 million profit and a $8 million loss, it was a meh draft.
Across the league and across the years, there have been 64 good drafts, 212 meh drafts, and 57 bad drafts. An average team would have a draft record of 2-7-2 (as did the New York Rangers).
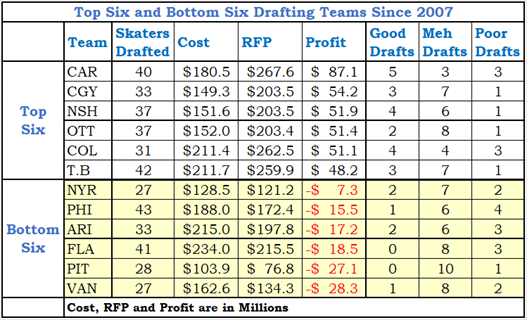
Carolina has far and away had the best results, while Pittsburgh and Vancouver have been bitten by the most snakes.
Even teams that draft well can have poor drafts, and teams that draft poorly can have good drafts. Most teams have “meh” drafts, drafts where the players return about what they were expected to return.
Five Worst Drafts
The last table below shows the five worst drafts by a team since 2007.
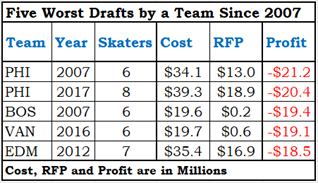
This is not a place where a team wants to finish 1-2.
In 2017, Philadelphia’s poor result came from drafting Nolan Patrick (picked at 2). In 2007, their poor result came from drafting James van Riemsdyk (picked at 2). All of the teams in the table used a high draft pick on a player who didn’t produce as much as expected.
Philadelphia’s 2007 draft shows the impact of high expectations (high draft investment): had van Riemsdyk been drafted somewhere with the 8th pick, his play would not have been a problem and Philadelphia’s 2007 draft would be nowhere near to the other teams on the list. But he had the expectations of a #2 pick, so he was a disappointment.
There are two ways in which a team’s draft can be disappointing. The obvious one is where their high-draft pick does not work out. Both of Philadelphia’s Failures were of that variety, as was Edmonton’s 2012 draft (Nail Yakupov, #1).
The second way is where none of the draft picks worked out, which happened to Boston and Vancouver. Boston only drafted two skaters in 2007, Zach Hamill (#8) and Tommy Cross (#35). Hamill played all of 20 games in the NHL, but his NHL career was 20 games longer than that of Cross. Vancouver’s 2016 draft is similar: two skaters; Olli Juolevi was selected at #5 and has played 41 games so far; William Lockwood at #64 has played 28 games.
Summary
The average team:
- Drafted 6.3 skaters and invested $16.4 million per draft;
- 3.3 skaters played in the NHL and they produced a return of $18.2 million;
- Made a profit of $1.8 million from their draft.
There are no big lessons to be learned here. The data do not reveal any secrets about who should be selected and who should be avoided. There is simply no way to know whether Connor Bedard will be an excellent pick or a poor pick. I’ll be happy to pronounce that judgment after the 2028-29 season.
Good picks by a team are seldom the work of genius by the great minds that guide their drafting. Good picks happen when the drafted player turns out to be better than everybody assumed they were.
Mark Stone, bless his Stanley Cup-winning soul, was a great pick at #178, but if the geniuses who ran the Ottawa draft are to be credited, they would have to explain why they drafted him at #178 and not earlier. Ottawa had traded their first-round pick to St. Louis for David RunBad (who used it to select Vladimir Tarasenko), their second-round pick to Edmonton, and their fifth-round pick to San Jose (so that the Sharks would take Dany F*****g Heatley off our hands). They used pick #76 on Jakub Culek, who never played in the NHL. They used pick #106 on Marcus Sorensen, whom they couldn’t sign. With their third pick of the draft, they snagged Mark Stone.
There is simply no way you can credit Senator management for any insight that Mark Stone would be such a success. If they thought he would have been half the player he turned out to be, they would have used their third-round pick on him.
Related Articles