A team that isn’t doing as well as was expected at the start of the season will have an unhappy fan base. An unhappy fan base will tend to focus on a specific player as the reason for this lack of success. Usually, the focus will be on a defenseman, sometimes a goalie becomes the scapegoat, and on rare occasions, a forward will be selected for sacrifice.
And so it is in Pittsburgh. The fan base wants a playoff team, the team isn’t in a playoff position, and somebody has to be responsible for this. It looks like the target is Erik Karlsson, a player with a superb playing history to go with his immense salary.
As Karlsson started his career in Ottawa, at least he is used to this sort of criticism.
Selected Quotes from the Interweb
An article on Sportskeeda has quotes from people who are posting on whatever letter Twitter is using this month. I’ll show you three of them.
- “Erik Karlsson flat-out sucks. The powerplay just flat-out sucks. Everything about this team sucks.”
- “How did Erik Karlsson score over 100 points on last year’s San Jose Sharks team?”
- “Old dudes can’t cut it anymore.”
My quick responses to those people are:
- False. Very true. False.
- Erik Karlsson had 74 of his 101 points at even strength on last year’s Sharks, 25 points more than the next closest defenseman. He was tied for 10th in the league in power-play scoring for defensemen.
- The “old dudes” comment is bad news for Jeff Carter, Evgeni Malkin, Kris Letang, Sidney Crosby, and Lars Eller. They are all older than Karlsson.
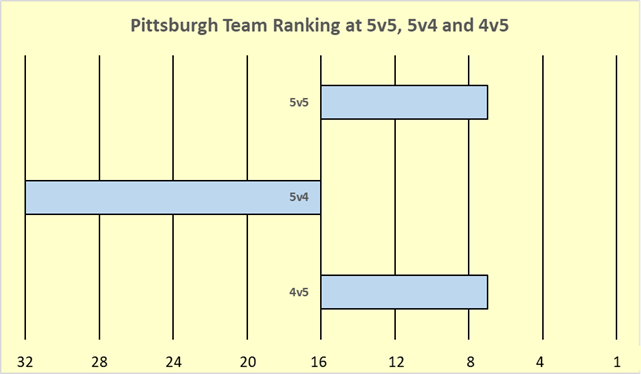
The Penguins as a Team in 2023-24 I like to look at teams in three manpower situations: 5v5, 5v4, and 4v5. The chart below shows how Pittsburgh ranked in the NHL in those situations (as of December 10, 2023).

At even strength and on the penalty kill (top and bottom bars), Pittsburgh ranked 7th in the league. On the powerplay, they ranked 32nd: dead last.
Their 5v5 rating was based on their 5v5 scoring: they had outscored their opponents 58-44. You could argue this is a little high because they outscored the Sharks 8-0 at 5v5 in their 10-2 victory. Ignoring that game would move the Penguins to 10th from 7th at 5v5.
On the 4v5 penalty kill the Penguins are also ranked 7th in the league, giving up only 3.64 goals per 60 minutes.
My goodness, but the Penguin powerplay has been pitiable. Not only do they have just six powerplay goals but have given up four short-handed goals. Their net powerplay output through 26 games is plus-two.
I used net goals scored per 60 minutes of 5v4 powerplay time to evaluate each team’s powerplay, using the formula below.

If you don’t understand the formula, don’t fret: I understand it.
The Penguins are in last place in the league with an NG60 of 1.05. To give you a little perspective on this statistic, the league average NG60 is 5.86, and the league leaders (Edmonton) have an NG60 of 11.19.
As Karlsson has a massive salary, as he was the highest-scoring defenseman last season, as he is new to the team, and as the powerplay is much worse than last year, the powerplay problems have to be his fault, right?
Who is Dragging Down the Powerplay?
There are two questions to ask when evaluating players on the powerplay: is the team getting chances to score, and how often does the team score? Expected goals data can tell us whether scoring chances are being generated, while actual goal data tells us whether goals were scored.
Expected goals are a weighted measure of a team’s shot attempts. This statistic recognizes that a shot from ten feet is more likely to be a goal than a shot from the blue line. To rank the players, I’ll be using net expected goals per 60 minutes (NxG60).

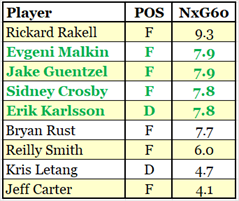
Richard Rakell has had 26.73 minutes of powerplay time with 4.91 xGF and 0.78 xGA, giving him an NxG60 of 9.3. He is the most effective Penguin on the powerplay. The next table shows the NxG60 of the nine Penguins with more than 20 minutes of 5v4 powerplay time.

The four players who are shown in bold green text are the most used powerplay specialists, each with more than 75 minutes of 5v4 time. As they play a lot with each other, their NxG60 data is quite close to each other. No other player on the Penguins has more than 50 minutes of 5v4 time.
The league average for NG60 is 6.7, so the four main Penguin players are generating more chances than the league average and are also above the league average for a first-unit powerplay (players with more than 60 minutes of 5v4 time have an NxG60 of 7.3).
So, when it comes to how the powerplay is generating scoring chances, how does Karlsson merit being responsible? His NG60 is the same as the other three main specialists, and it is much better than Kris Letang’s NG60. For those fans who want to blame Karlsson, I suppose they would now say that Kris Letang looks bad because he is on the second powerplay unit.
The problem with that argument is that he hasn’t solely played on the second powerplay unit: he has played a bit with the main forwards. Naturalstattrick.com provides data for pairs of players in various manpower situations, so I checked how the big three forwards did when they were paired with Letang on the powerplay, and also on how they did when paired with Karlsson (EK65).

When paired with Letang, the big three have generated almost no offense. They generate about three times more offense when paired with Karlsson.
Emotion-driven fans can be inventive when faced with statistics that don’t support their position. They will now want to use a different statistic. You can almost hear their words echoing out of their heads: “Powerplays are about scoring, not generating chances.” Let’s see how the Penguins did when it came to actual goals for and against on the powerplay.
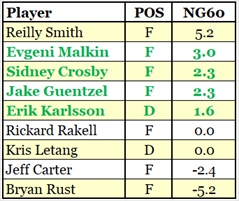
As you will recall, this requires using the NG60 statistic.

These results show several things: the Penguin powerplay is not scoring (league average NG60 is 5.9); Karlsson is better than Letang, and; Rust should not be allowed on the ice in a powerplay situation.
Rust has 34.58 5v4 powerplay minutes, and the Penguins have been outscored 3-0 in that time. OUTSCORED!! 342 players in the NHL have had at least 20 minutes of 5v4 powerplay time, and Mr. Rust’s NG60 puts him in 342nd place.
The other Penguins aren’t exactly basking in the sunshine at the top of the list of 342 players. Crosby is 274th, Karlsson is 295th and Letang is 315th.
Summary
Complaining about Karlsson’s performance this season shows that either fans do not understand statistics, or that they just do not look at them. The only number many fans see for Karlsson is his $92,000,000 contract.
As much as I hate to admit it, this perspective is quite logical.
While Pittsburgh didn’t sign Karlsson to his contract, they did trade to acquire him and his contract. San Jose kept a slice of Karlsson’s salary in the trade, and the contract has only four seasons remaining, so Pittsburgh will be paying Karlsson $40,000,000 over those four seasons. That’s still a lot of money for an “old dude.”
Many fans expected that Karlsson would score even more this season than last, given that this season he would be playing Crosby and Malkin and Guentzel, and would be playing in Pittsburgh instead of San Jose. It was always more likely that his output would probably drop this season compared to last season. It is extremely unlikely that a player would follow up his best season in seven seasons with an even better season, and Karlsson is also another year older. He is now in the age range where declining performance should be expected, but he is at a skill level where that decline should be gradual.
It must be noted that Karlsson’s season is not the result of him moving to a new team. An earlier article (A Player’s First Season on a New Team) shows that players do not have a drop in production after moving to a new team; they have drops in production after having had great seasons.
I’d like to think that the data in this article shows that Karlsson’s play is not the reason for the lack of production from Pittsburgh’s powerplay. The first unit is a little better at generating chances than the league average, and Karlsson is the most effective Penguin defenseman when paired with Crosby, Malkin, and Guentzel.
Pittsburgh has scored (actual goals, 6) 38% of the powerplay goals they should have (expected goals, 15.96). The league average is 91%. That lack of scoring is not the fault of a specific defenseman, it is the fault of every player on the powerplay.
Related Articles
