
Based on data from a new data source, I can now investigate the influence that a faceoff has on goals being scored.
In this article, I’ll explain the new data source, explain the terminology that will be used, look at how the location of a faceoff influences goal-scoring, and finally look at how the time passed since a faceoff influences goal-scoring. That’s a lot of stuff to look at, so let’s start.
A Closer Look at the Data Being Used
My normal data source is NaturalStatTrick.com, where I get season-level data for players and teams. For example, Patrice Bergeron (BOS) took 1,706 faceoffs last season with a record of 1,043-663.
For this study, I will be using data purchased from BigDataBall.com which contains the play-by-play reports for each game from the 2022-23 season. My normal dataset has about 1,000 records, one for each skater who played at least one game in a season. The BigDataBall dataset has more than 600,000 records, one record for each line in each play-by-play report from each game (regular season and playoff).
For example, in a game between Boston and the New York Islanders, Patrice Bergeron took a faceoff in his offensive zone at 8:57 of the second period, losing to Casey Cizikas. At 9:28, Matt Martin took a 30-foot wrist shot that was stopped by Linus Ullmark, and the play ended there. In all, there are three records for this sequence of plays: one describes the faceoff, one describes the successful shot attempt, and one describes the stoppage in play.
Data Exclusions and Limitations
I will only use data from regular season games, excluding playoff games.
The dataset may not record some stuff you might think it does.
With respect to the earlier example with Patrice Bergeron’s faceoff, there is no information in the dataset as to how the puck got from the Islander zone to the Bruin zone. I think of this information as “zone changes.” There were, at minimum, two-zone changes between the faceoff and the shot: from the Islanders zone to the neutral zone and from the neutral zone to the Bruins zone.
On goals scored well after an offensive zone faceoff by the team who was on offense, the play-by-play report does not tell us if the offensive team kept the puck in the offensive zone for a long period of time.
Terminology Used in This Article
A play sequence starts with a faceoff and ends with a whistle (or with a horn at the end of a period). The phrase “shift” cannot be used for this, as “shift” normally refers to a player being on the ice for a continuous period of time. One player’s single shift could have multiple play-sequences, and a long play-sequence will contain many player shifts.
Play sequences can begin in the neutral zone (centre dot or one of the four dots just outside the bluelines) or in an attacking zone (one of the four dots near a team’s net). A faceoff in an attacking zone will have one team in its defensive zone and the other team in its offensive zone.
A goal sequence is a play sequence that ends in a goal.
Play-Sequences and Goal-Sequences: Duration
Before I started playing with this data, I reasoned that:
- there are about 60 faceoffs in a game.
- a game is about 60 minutes long (overtime games make the average game a little longer than 60 minutes);
- therefore, the average play sequence should be about 60 seconds.
My logic was solid, as the average play-sequence was 64 seconds.
I also thought that since a goal ends a play sequence, a goal sequence would be about as long as a play sequence.
Again, the logic is solid: the average goal-sequence is 67 seconds. This figure is a little higher than the play-sequence average because of how overtime is played. During regulation the average goal-sequence is 64 seconds; it is 73 seconds in overtime.
Overtime goal sequences are longer because of the way that some teams (or all teams) play in overtime. The team with the puck will sometimes cycle in and out of the offensive zone, attempting to get fresh skaters on the ice while forcing their tired opponents to stay on the ice for more and more time.
Goals Scored by Location and Faceoff Winner
What influences scoring more: who wins the faceoff or where the faceoff is held?
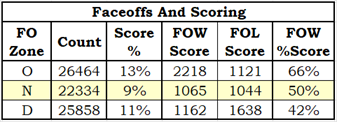
The table above shows that the location of a faceoff is actually more important than who wins the faceoff. The Faceoff Zone used in the table was determined by the team which won the faceoff.
Offensive zone faceoff winners outscore the defenders at a rate of 2:1. Neutral zone faceoffs have neutral results, with faceoff winners and faceoff losers scoring almost equally. Defensive zone faceoff winners are outscored at a rate of 3:2. Just as in real estate, it’s mostly about location, location, location.
What about the times when a goal is scored quickly? In those instances, surely the faceoff winner is more important than the location of the faceoff. Right?
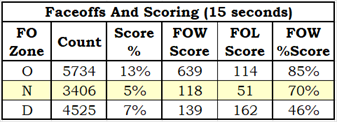
The table above shows scoring results on play sequences that were 15 seconds or shorter. When a goal is scored rapidly, the faceoff winner is more important. But if a team wins a faceoff in its defensive zone and a goal is scored within fifteen seconds, it is more likely that the faceoff winners were scored on than they scored.
Note the drop in scoring frequency (score %) for neutral and defensive zone faceoffs. Obviously, the farther away you are from a net, the longer it takes to score.
Faceoff Winner’s Goal Margin by Time
The most interesting faceoff and goal information involves how long the winning of a faceoff influences the scoring of goals. The following chart very clearly shows how long that influence lasts.
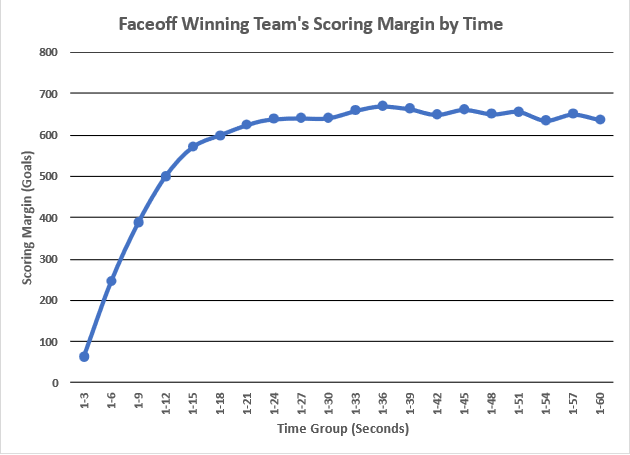
The vertical axis shows the gap in goals scored between the faceoff-winning team and the faceoff-losing team, while the horizontal axis shows the time elapsed since the preceding faceoff in groups that are progressively three seconds longer. As an example, at twelve seconds after a faceoff (columns 1-12), the teams that won faceoffs were ahead by a total score of 720-222, a gap of 498.
Faceoffs influence goal-scoring significantly in the first fifteen seconds, with the faceoff winner scoring significantly more frequently than the faceoff loser. After about 27 seconds, winning a faceoff has just a little influence on which team scores: the scoring margin stabilizes from that point on to a very slight edge for the faceoff winner.
After 30 seconds the goal margin was 640. By two minutes after a faceoff, the goal margin is around 750. That means that the goal margin for the faceoff-winning team increased an average of 21 goals per second in the first 30 seconds after the faceoff, and then increased at an average of 1 goal per second over the next 90 seconds. A faceoff is 21 times less influential after the first 30 seconds.
Putting the Scoring Gap into Perspective
It is my opinion that faceoffs are less important than generally perceived. Don’t get me wrong: it is nicer to win a faceoff than lose it, and there are instances where winning the faceoff is a critical part of scoring a goal.
My opinion seems to be in conflict with a fact I cited in the previous section: after 30 seconds, the faceoff-winning team had a goal margin of 640. 640 is a heck of a lot of goals, at least twice as many as any team scored last season (exception: Edmonton scored 325 goals, so twice as many for them would be 650). How can I say faceoffs are less important than generally perceived?
I can say that because I am looking at all faceoffs, not just those that result in goals. I determine the value of faceoffs before the puck is dropped, not after.
There were 74,656 faceoffs last season and the goal margin for the faceoff-winning team was 868 goals, so winning a faceoff is worth 0.0116 goals. It takes 86 faceoff wins to get an advantage of one goal. Patrice Bergeron’s 1,043-663 faceoff record, winning 380 more faceoffs than he lost, gave Boston an advantage of 4.4181 goals on the season.
Summary
In this article, we learned that the location of a faceoff has more influence on scoring than does the winning of a faceoff.
The steep slope at the left-hand side of the Faceoff Winning Team’s Scoring Margin by Time chart shows the period of time (first fifteen seconds) in which the faceoff winners gain their biggest advantage. The advantage starts to level out between 15 seconds and 27 seconds. From 30 seconds after a faceoff, the advantage for the winning team is constant but minimal.
Related Articles
None.
Well, I suppose Important Faceoff Takers is somewhat related, as it also uses faceoff data. It looks at who takes important faceoffs but does not look at what happens after a faceoff. This article looks at what happens after a faceoff with no regard to who took the faceoffs.