Every team has played at least five games. The Jets went 5-0-0 while Nashville went 0-5-0. What does recent history say about a team’s chances of making the playoffs? I’ll start with the results, followed by details of the analysis.
My father recently passed away, and in his honour, I used the Harrington font for the numeric data in the tables of this article. Dad liked his “flat top” 3.
Historical Perspective on Playoff Chances After Five Games Played

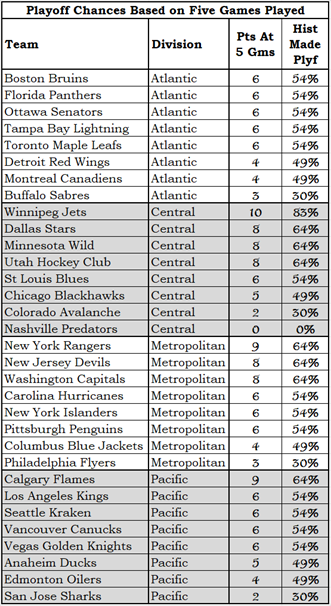
In the table, teams are sorted by Division, Points After Five Games Played (Pts At 5 Gms) and then team name.
Should Nashville be in a panic because they haven’t done well after five games? No, for the same reason that the Flames and the Rangers should not start coasting just because they have done well in their first five games: there are 77 games remaining in the season.
The historical data, which came from all 82-game seasons played since 2007-08, does show that teams with better starts tend to end up with better results. At the five-game mark of the season, those tendencies are not statistically significant. Which is another way of saying that there are 77 games left.
The final standings are not locked in stone after five games. Nashville can be the first team since 2007-08 to start the season 0-5-0 and make the playoffs: all they have to do is figure out how to score at even strength.
Interpreting the Historical Data
My preferred data source is NaturalStatTrick.com: its data goes back to 2007-08, which explains my starting point. I wanted to compare a team’s five-game start to its final results after 82 games, so I removed the lockout-shortened season of 2012-13 and the pandemic-reduced seasons of 2019-20 and 2020-21. In all, there were 428 teams to examine.
For each of these teams, I recorded the number of points they had after their fifth game and the number of points they had after 82 games. As an example, the 2015-16 Boston Bruins had four points after five games and finished the season with 93 points.
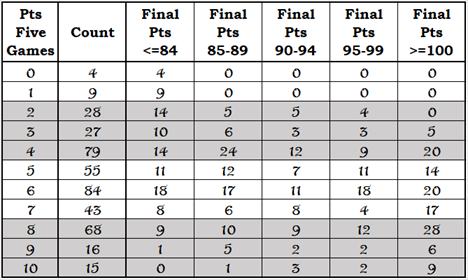
The table below shows the counts of five-game points by final points, shown below. Continuing with the Boston Bruins, 12 teams started the season with four points and finished the season with between 90 and 94 points.

Separately, I recorded the final standing points of teams and whether they qualified for the playoffs. 60 teams finished a season with 90 to 94 points, 32 of them made the playoffs.

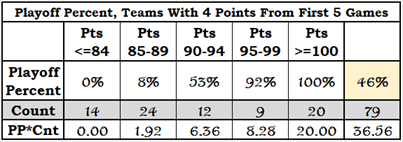
Now I combined these two sets of data. For each number of points from the first five games of a season, for each range of final points they had, I calculated the number of playoff berths that represented. As the 2015-16 Boston Bruins started with four points, I’ll show you the details used to calculate the playoff chances of such a team.

Twelve teams started the season with four points and finished the season with 90 to 94 points. That represents 6.36 playoff berths (12 times 53%). In total, 79 teams had four points in their first five games, which represents 36.56 playoff berths (46%).
Doing that for all 11 five-game point totals (0 to 10), you get the following chart.

Here we see the “small-n” problem: “small-n” means “small sample size.” While 428 teams may seem like a lot, by the time they are divided into 11 groups based on five-game point totals, some of the groups are very small.
Instinctively we feel the line should be straight-ish:, yet it isn’t. Common sense tells us that playoff chances should increase if a team has a better start, but 9-point teams had worse results than 8-point teams. These discrepancies are related to the small size of the sample.
It would have been silly to say that the New York Rangers (4-0-1 start) had a 58% chance of making the playoffs and the New Jersey Devils (4-1-0 start) had a 66% chance. To not look silly, I calculated the playoff chances for ranges of five-game starts, determining the groups based on a number of wins coupled with a number of wins and one tie. The “4-5” group below conceptually represents teams that started 2-3-0 and 2-2-1.

The final row in the table above is the source for a team’s playoff chances shown in the table that appears at the start of this article.
Summary
It is important to understand that the playoff chances shown in the results table at the start of the article are based solely on the history of teams that started the season with the same number of points. This season’s history has yet to be determined.
Boston, Florida, Ottawa, Tampa Bay and Toronto are all at 54%, because teams that start the season with six points in five games made the playoffs 54% of the time.
Two other articles will be produced that are in the category of playoff chances based on a number of games played.
First up will be an article about where playoff chances are based on any five-game span. Looking at all five-game spans removes the “small-n” problem: 33,384 is greater than 428.
When all team have played ten games I’ll update the “based on history” playoff predictions.
Related Articles
Ten Games In – Playoff Chances
Any Five Games – Playoff Chances
