
In the third of a series of articles that examine the playoff chances of teams based on a certain number of games played, this article will look at any five-game period. The two other articles looked at the first five and the first ten games in a season.
Finally, Enough Data
In an 82-game schedule, there is one set of “first five” games. In the seasons I could use (2007-08 to 2011-12, 2013-14 to 2018-19, 2021-22 to 2023-24) there were only 428 sets of “first five games.”
There are a good few more sets of “any give games.” 33,384 sets, to be precise. That is because there are 78 five-game sequences in an 82-game season: games 1 to 5, games 2 to 6, games 3 to 7, skip a few, and games 78 to 82.
Five Straight Games – Making the Playoffs
The following chart shows the frequency with which teams made the playoffs based on the results from five straight games.
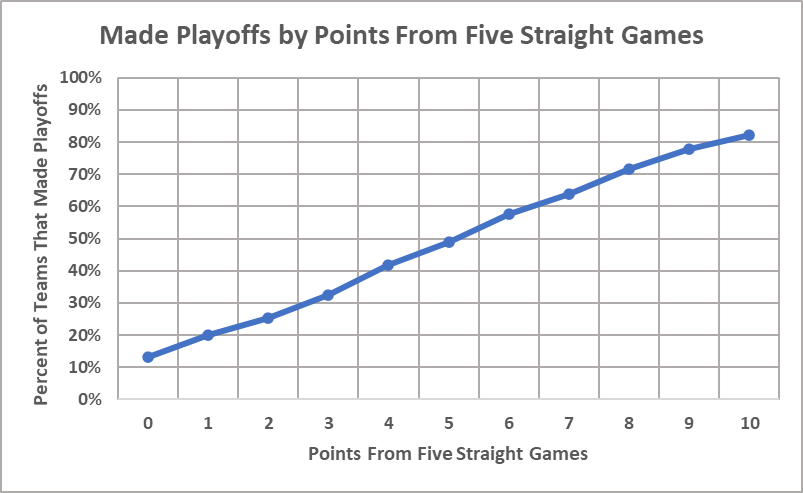
To be perfectly clear, “making the playoffs” was based on a team’s final points in a season, not on the fact that they made the playoffs. This method is more fully explained in the Five Games In article.
A team that finished the season with 93 points is considered to have had a 53% chance of making the playoffs, and that 53% chance would be assigned to all 78 of their five-game sequences. This fuzzy area is shown in the next chart.
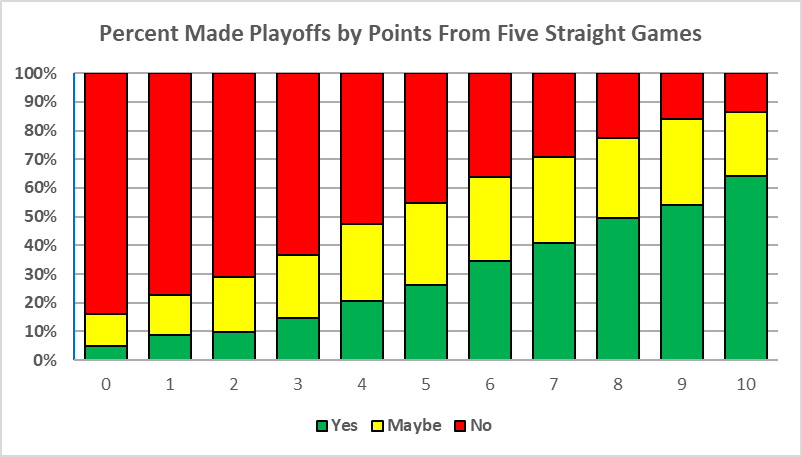
This “traffic-light chart” gives a breakdown of the certainties of making the playoffs based on a five-game sequence. Green represents teams that finished the season with at least 100 points; yellow represents teams that had between 85 and 99 points; red represents teams that had no more than 84 points.
Look at the three columns on the left and right sides of the chart. Having really bad five-game sequences (1-4-0 or worse) is more negatively determinative than really good five-game sequences (4-1-0 or better) is positively determinative. The green boxes in the leftmost columns are smaller than the red boxes in the rightmost columns.
Looking at the Data from a Different Perspective
So far the perspective has been forward-looking: five-game results to playoff chances. Another way to look at the data is to compare the best and worst five-game sequences of playoff teams and non-playoff teams.
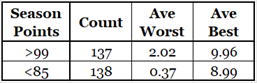
Playoff teams are those that finished the season with at least 100 points, while non-playoff teams had no more than 84 points. The number of teams in those two groups, shown in the Count column, is almost identical. The average best and worst five-game sequences for these two groups of teams are quite different.
The most points you can get from a five-game sequence is ten, so when the average of 137 teams is 9.96 it means that playoff teams almost always have a five-game winning streak during the season. Only six of 137 teams didn’t have a five-game win streak.
But having a five-game winning streak is not the final word for a team: 55 non-playoff teams had five-game winning streaks.
The biggest difference is in the worst five-game sequences. Only 14 playoff teams had a five-game losing streak, while 98 of the non-playoff teams had an 0-5-0 streak.
Summary
Over the course of a season, many teams will have both a five-game losing streak and a five-game winning streak. In the seasons I studied 90 teams did that (21% of teams), which works out to a little more than six teams per season.
Five-game sequences have playoff implications, but not at the statistically significant level. Teams with five-game losing streaks have gone on to win the Stanley Cup, and teams with five-game winning streaks have finished last in the regular season.
The shortest game sequence that is statistically significant is eight games: if a team loses eight straight games it has made the playoffs 1% of the time.
The best indicator of a team’s chances of making the playoffs is their 82-game point total, especially when compared to the 82-game point totals of other teams in their Conference and Division. It isn’t predictive, but it is accurate.
Related Articles
Five Games In – Playoff Chances