
Just after the end of the 2023-24 season, I heard two radio commentators say that Ottawa needs to drop its goals against average (GAA) by half a goal to be a playoff contender. Over 82 games that is 40 goals against fewer. (Pedantically, 41 goals fewer.)
How can a team drop their GAA by 0.5? Hell, if I know: that is not my area of expertise. My area of expertise is numbers, so I asked the numbers some questions.
How many teams have dropped their GAA by 0.5 from the previous season? Did they get a better record? Did they improve their team defense or did their goalies play better? Did they maintain their defensive improvement the following season? Is dropping goals against the only team improvement goal worth pursuing? What factors come into play for Ottawa’s chances to improve their defense as they go into the 2024-25 season?
The Wording in This Article
When I use the phrase “half goal” in this article, it will usually stand for “half a goal per game”. For example, Ottawa would like a half-goal defensive improvement.
The Influence of Scoring on Defense
Scoring has been up these last seven seasons (2017 to 2023), as shown by the blue line in the League GA60 by Season (With ½GB Counts) chart. Strangely enough, when scoring increases it also increases the likelihood that a team can improve defensively by a half-goal. The red line in the chart shows the count of teams that made a half-goal improvement on defense (½GB = half-goal better).
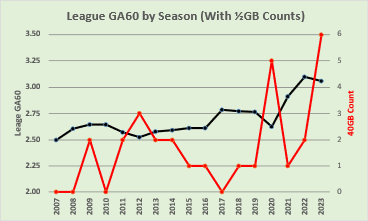
29 teams improved their defense by half a goal over the previous season since 2007-08. Since 2017, when the offense went up, it has happened sixteen times. Before 2017 it only happened thirteen times.
In a season when league offense goes up significantly (2017, 2021, 2022) it is harder for teams to improve defensively because they are “swimming upstream.” For a team to improve a half-goal when the average team increases its goals for, by 0.15 goals, they would have to reduce their goals against by 0.65 goals per game relative to the league.
Conversely, when league offense goes down (2020, slightly in 2011 and 2023) it is easier for teams to make half-goal defensive improvements, as they are swimming with the stream.
In 2023, six teams had half-goal defensive improvements. Let’s take a closer look at them.
2023 – Half-Goal Better on Defense
As you will see in the next two tables, not all of the six teams that improved a half-goal defensively improved in the standings. Three of them improved, one team broke even and two teams lost ground. The first table shows the teams that had little to no improvement in the standings and the second table shows the teams that improved.
There are three columns for each team, showing their 2022 data, their 2023 data, and the season-to-season change. Pts are standing points. GA is goals against, while GF60, GA60, and GD60 are 60-minute averages for goals for, goals against, and goal differential.
xGA/100CA, which is expected goals against, per 100 shot attempts against, measures a team’s defensive play. Obviously, the lower this value the better your team’s defensive play is, as your team is giving up less dangerous scoring chances. The 2023 league average for xGA/100CA is 4.88.
SvAA60, saves above average, and measures a team’s goalie play, showing how the goalies did based on the quantity and quality of the shots they faced. Positive values are good.
The last row, Goalies, shows the season counts for all goalies for a team in saves above average: it is SvAA instead of SvAA60. Again, positive values are good.
Some of the cells in a team’s Change column are shaded yellow, highlighting poor results in the category amongst these six teams. Green-shaded cells highlight good results.
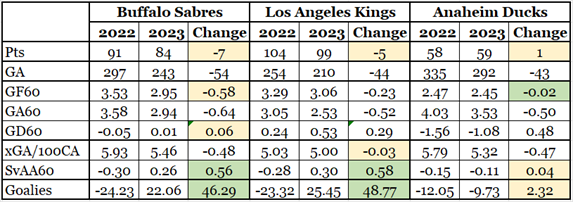
Buffalo gave up 54 fewer goals, but also they scored 49 fewer goals. Despite their defensive improvement, they had practically the same goal differential as in 2022. The Sabres provide us with a critical lesson: teams do not win solely because of defense; they win because they have a higher goal differential. They were as effective in 2023-24 as they were in 2022-23, except their season was 103 goals less exciting.
Los Angeles had no improvement in the quality of shots they gave up. That could almost be expected, as their 2022 value (5.03) was better than the other five teams’ 2023 values.
Anaheim improved their defense without reducing their offense and should have had a better result in the standings. The Pythagoras Point Prediction Process – Hockey Variation (see Appendix A) indicates that Anaheim should have had 67 points.
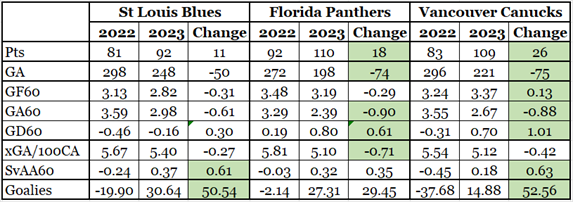
St. Louis improved in the standings by 11 points. Their goals-against reduction of 0.6 goals per game was slightly negated by a goals-for reduction of 0.3.
Florida made a huge defensive improvement, dropping 74 goals, leading to an 18-point increase in the standings. While their goalies played better, the team’s defense also played a significant role in their defensive improvement: xGA/100CA was 0.71 lower.
Vancouver did exactly what every fan wants their team to do: reduce their goals against and increase their goals for. This led to a 26-point improvement in the standings.
Four of the Six Teams
Four of the six 2023 teams (BUF, L.A., STL, and VAN) made their half-goal improvement through the play of their goalies. Each team’s goalies were 46 to 53 goals better. Florida’s goalies were 29 goals better, while Anaheim’s goalies were only two goals better.
The biggest problem with achieving a half-goal drop through the play of goalies is that goalie play fluctuates a lot from season to season. It is like winning a poker tournament because you got dealt good hands, rather than because you played well.
I can show these goalie fluctuations using my new rating system for goalies: Goalie Expected Points. It is based on time-on-ice and saves above average.
Consider the career GxPts charts of the main goalies for St. Louis (Binnington) and Los Angeles (Talbot).
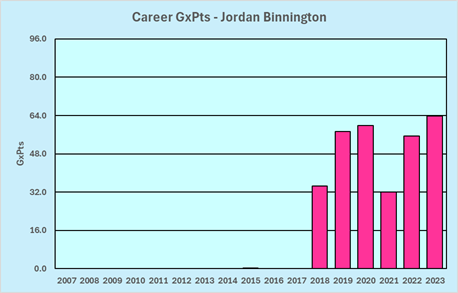
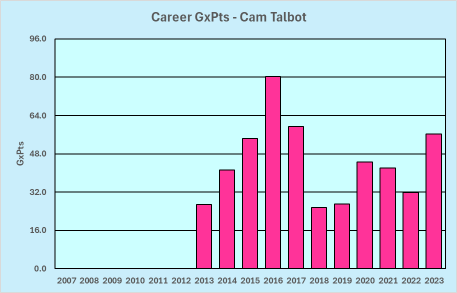
A lot of fans think their team’s goalies run on a two-year cycle, that they are good one year and poor the next. In my opinion, the season-to-season fluctuations for goalie play are real but not regular. Talbot’s career (start, better, better, better, worse, worse, same, better, same, worse, better) is what normally happens for goalies, while Binnington’s career (start, better, same, worse, better, same) would be quite unusual if it continued.
The Season After a Half-Goal Defensive Improvement
When teams make a big defensive improvement, do they maintain that level of defense the following season? Of the 29 teams that have made the half-goal improvement, 23 of them have had a subsequent season (the six from 2023-24 are going to play their subsequent season in 2024-25).
Only three of those 23 teams maintained their defensive improvement: 2013-14 Carolina, 2013-14 Tampa Bay, and 2014-15 Florida. A half-goal defensive improvement is very hard to maintain for more than one season.
On average, a team that made a half-goal improvement dropped their goals against, by 0.69 goals per game, and the next season their goals against increased by 0.46 goals per game. At the season level, a team that improves defensively by 40 goals one season will give back 27 of those goals the following season.
Defense vs. Offense vs. Difference
Is dropping goals against the only strategy worth pursuing? There are two other options: improve your offense and improve your goal differential. I ran the numbers on how teams that had half-goal improvements in offense and in goal differential, have done, and the results were both surprising and as expected.
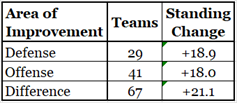
What I looked at was how many teams improved in each of these areas and the average change in standing points in the season they improved.
One surprise is that a half-goal defensive improvement is the least likely improvement (29 teams). That is related to the increases in offense since 2007-08. A bigger surprise is the number of teams that improved their goal differential (67) by a half-goal. I had thought this would happen about as frequently as improvements in offense or defense, but it happens almost twice as often.
Not surprising at all is that an improvement in goal differential is more valuable than improvements in just offense or just defense, about one win is more valuable in an 82-game season. The reason for that is that a half-goal improvement in offense or defense might not produce a half-goal improvement in differential. Recall Buffalo’s results from 2023-24: a defensive improvement of -0.64 goals per game coupled with an offensive decline of -0.58, resulting in a change in scoring differential of +0.06 goals per game.
What does this tell us? First, it shows us that it is more important to improve your team’s goal difference than it is to strictly improve its defense or offense. Second, it shows us that it is easier to improve differential than it is to improve either offense or defense.
To those people who say that you cannot win without defense, here is some tough news: you are wrong. You have to outscore your opponents to win. Goal differential, a team’s offense compared to its defense, is more important than just defense.
Ottawa’s Prospects in 2024-25 – With Respect to Their Defense
Say you have two friends, one of whom weighs 225 pounds while the other weighs 275 pounds. Which of your friends is more likely to be able to lose 40 pounds? It’d be the heavier friend, as that person has more excess weight and might have a few bad habits that are “easy” to eliminate. (I know, from much dieting experience, that changing any bad eating habit is far from easy.)
This happens in hockey, too, except that “pounds” are “goals against”. Detroit, who allowed 273 goals last season, is far more likely to get down to 232 goals against than the New York Rangers are likely to get down to 185 goals against (from 226).
I divided the teams since 2007-08 into five equally sized groups based on their GA60, and counted the number of teams in each group that had a half-goal improvement. The results are in the following chart.
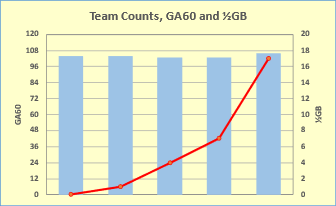
The blue boxes show the counts of teams grouped by GA60, and its scale is on the left axis. Each group contains between 103 and 106 teams. The GA60 ranges for each group are not shown as they were selected to make every box as similar in size as possible. The first column represents the best defensive teams, while the last column represents the worst defensive teams.
The red line shows the number of teams in each group that had half-goal improvements, and its scale is on the right axis. By group, from the left, the counts are 0, 1, 4, 7 and 17.
If Ottawa was one of those two friends I mentioned at the start of this section, they would be the 275-pound friend. Ottawa’s 2023-24 performance had them in the rightmost box, where teams have an almost 17% chance of getting a half-goal improvement. On the other hand, Ottawa has been in that box since 2017-18 and haven’t yet had that half-goal improvement.
Ottawa’s Prospects in 2024-25 – Expected Goals
If only. If only the Senators could score and defend at the level of their expected goal data, they would be a much better team.
I’ve come up with a statistic called WRTx, which stands for with respect to expected goals. If a team’s WRTx number is positive, it means they did better than expected: they score more goals than expected or they give up fewer goals than expected. If it is negative, it means they did worse than expected.
Since the 2019-20 season, Ottawa has been in the negative on defense every season. Their average WRTxGA is -23.5. While I don’t like criticizing individual players (except for Ryan Reaves, of course) WRTxGA is solely a measure of the play of a team’s goalies. Ottawa’s goalies have given up almost 25 more goals per season than expected, and the expectation is based on the quantity and quality of shots they faced.
On offense, Ottawa was in the negative for all but one of those seasons. Their average WRTxGF is -12.6. The Senators are the gang that can’t shoot straight (referencing a poor 1971 movie).
Putting those two numbers together, Ottawa’s average WRTxGD (goal differential) is -36.1.
How has this failure to meet expectations affected the Senators? To get an idea of that, I will compare the standing points they should have had based on actual goals with the standing points they could have had based on their expected goals.
Based on actual goals, Ottawa should have had 83 points last season. While this is better than the 78 points they actually got, it would still leave them well short of a playoff spot. Based on expected goals, Ottawa could have had 97 points last season, which would have put them in the playoffs.
This is one of the key frustrations of being a fan of the Ottawa Senators. They play like a playoff team except for that small part of the game related to scoring and preventing goals.
If Ottawa simply met their expectations, they would be 85% on the way to a half-goal improvement in goal differential.
Ottawa’s Prospects in 2024-25 – New Coach in Town
Travis Green will be the coach of the Senators in 2024-25. The fans wanted the new coach to be an experienced head coach with a winning pedigree and a defensive mindset, but those coaches could not be convinced to move to Canada’s capital.
I got the impression from some of the coverage that Travis Green is a hard ass. This is, to a degree, the sort of coach that many Ottawa fans want the team to have. It is felt that their lackadaisical defensive play has been fostered by a series of coaches who were not hard on the players and that there has been too much avocado toast for the team’s pre-game meals.
Let me digress for a paragraph on hard-ass coaches with an example from my life. There are two ways to be a hard-ass coach: you can be tough but fair, or you can be a jerk. I was in the militia for many years, and the company Sergeant Major is the equivalent of a coach. The Sergeant Major is usually a hard ass, that being one of the trade qualifications for the position.
I was blessed to have a tough but fair Sergeant Major. If you screwed up, he’d let you know about it. If you did things properly, he wouldn’t bother you. I had a friend in another unit who had a jerk for a Sergeant Major. You could get given extra duties just so this jerk could flex his rank and position, even though you had done everything properly. This approach was counterproductive, as the morale in that unit plummeted.
Whether Mr. Green is a hard-ass or a soft-ass I cannot say: the data at hand cannot be used to determine that. If he is a hard-ass, I hope that he is the tough but fair type.
Some data shows how Mr. Green’s coaching has influenced his team’s defense, coming from a four-year tenure in Vancouver. The Vancouver Defense with Travis Green as Coach chart has three lines. The blue line shows CA60 (shot attempts against per 60 minutes), the green line shows xGA60 (expected goals against) and the red line shows GA60 (goals against).
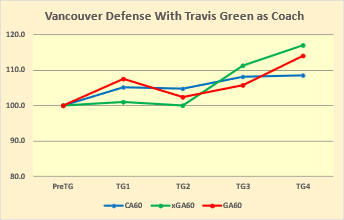
The first data point for all lines is called PreTG, which represents the season before Travis Green started in Vancouver. All three lines are at 100, which is their baseline. In the next four seasons, the team’s statistic was divided by the baseline statistic. For example, in TG1 Vancouver’s CA60 was 57.9, while its PreTG CA60 was 55.0. 57.9 divided by 55.0 is 105.3, which is the blue point in the TG1 column.
If the line goes up, that aspect of defense is higher (worse) than it was before Travis Green arrived. If the line went down it would indicate the defense was improving, and you will notice that the lines did not go down.
The data indicates that Travis Green was not able to get his team to improve defensively.
Summary
I don’t like making predictions, so I won’t say whether I think Ottawa will get a half-goal improvement on defense. I’d rather they get a half-goal improvement on goal difference, whether that comes from better defense, better offense, or a combination of both.
If Ottawa sacrifices offense to improve defense, they’ll go nowhere in the standings: that’s what happened to the Buffalo Sabres last season.
I am continuously drawn to the expected goal data. How can a team consistently score fewer goals than expected and consistently give up more goals than expected? Is it just luck?
Related Articles
Goalie Expected Points
Appendix A – Pythagoras Point Prediction Process (Hockey Variation)
I first became aware of this process through Bill James, the author of The Baseball Abstract. I don’t know him personally, of course, but I know a lot of his baseball writing.
The basic idea is that the record a team should have can be estimated based on the square of the runs they score and allow. The baseball Pythagoras formula cannot be used for hockey because baseball doesn’t have tie games (and, pedantically, they don’t have goals).
The hockey variation is designed for an 82-game NHL season and uses goals for and goals against. Expected goals can also be used, so you could see the results a team should have had if they had scored as expected (not recommended for Ottawa Senators fans).
Let’s walk through a specific example using the Anaheim Ducks from 2023-24, who scored 203 goals and allowed 292 goals. First up, how many wins should they have had? If you aren’t sure what “square” means, it is the number multiplied by itself. 203 squared is 41209.
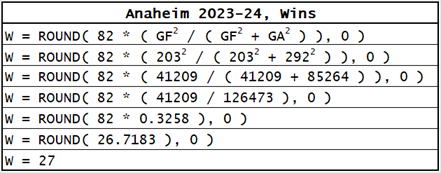
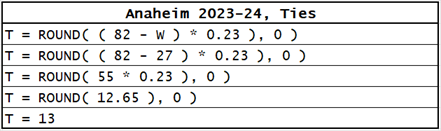
Now it is time to introduce the necessary variant for hockey, the number of ties Anaheim should have had. Based on standing data since 2007-08, teams get credited for a tie in 23% of the games they did not win.
The easiest part of the process is determining how many games a team should have lost, as they lose every game they don’t win or tie.
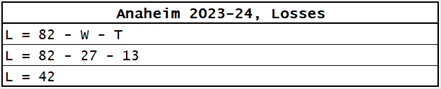
The previous step wasn’t necessary to determine the number of points Anaheim should have had. It is used to produce a season record: 27-42-13. Standing points, the last step, are based on two points for a win and one for a tie.
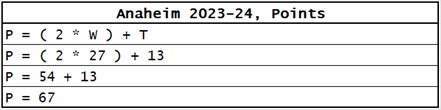
Anaheim should have had 67 points last season. They actually had 59 points, so they suffered a bit of bad luck over the season. The formula is normally “more accurate” than that: about two-thirds of the time the Pythagorean prediction is within four points of a team’s actual points.