
I have been playing with hockey statistics for the better part of the last ten years. While I have created some nice rating systems for skaters, such as Productivity Rating and Value Rating, I have not created a really good rating system for goalies, until sometime around midnight on April 29th, 2024.
Mind you, I thought I had an acceptable rating system for goalies (Introduction to Goalie Rating). Looking back on that now, I would say it was merely a step in the right direction.
In this article, I will show you how GxP works, who it helps, who it hurts, and what it eats for breakfast. I will show the top goalies from this season and the top goalies of all time, provided we agree that time started at the beginning of the 2007-08 season.
The Deficiencies of the Goalie Rating (GR) System
To be fair, GR correctly handled the better goalies in a season, giving them top marks. Where it missed was in how it handled both the lesser goalies and the goalies who rarely played.
GR was based solely on Saves Above Average (SVAA). The better goalies had better scores, while the lesser goalies and the less frequently used goalies could have similar scores.
SVAA is determined by subtracting the goals a goalie gives up (GA) from the goals he was expected to give up (xGA). If a goalie gave up 80 goals and was expected to give up 85.2 goals, his SVAA would be +5.2. A goalie who gives up 84 goals and who was expected to give up 74.7 goals would have an SVAA of -9.3.
When you start moving towards the middle of the pack, you have to consider which goalie’s season should be more highly rated: a goalie who played 2000 minutes and gave up 18 more goals than expected, or a goalie who played 1000 minutes and gave up 8 more goals than expected? And how do those two goalies compare to one who played 300 minutes and gave up 2 fewer goals than expected?
By using both TOI and SVAA, GxP answers those questions much more competently.
GxP: Goalie Expected Points System
Late at night on April 29th, I was working on how to properly use TOI and SVAA. I wanted something that would rank a goalie who played 3000 minutes with a negative SVAA higher than a goalie who played 1500 minutes with a positive SVAA, because a goalie who played 25 more games during the season did more, in my opinion.
Inherent in my Productivity Rating system is the concept that time on ice is worth more than sitting on the bench. A skater that has 300 more minutes of ice time than another should get, and usually does get a higher rating. For the player with less time to get a better rating, he has to have significantly better scoring data.
Also inherent in my rating systems for skaters is that counts are more important than rates. Counts are measures of play and rates are descriptions of a player. When looking at a defenseman who played 80 games, I will rate him based on the 2000 minutes of ice time he had (a count), but I would describe him as a 25-minute-a-game defenseman (a rate). While 2000 minutes and 25 minutes per game have the same basic meaning for this player, the Productivity Rating formula uses the number 2000. A player who played 1000 minutes in 40 games also averaged 25 minutes per game but will not receive as much credit for his ice time as his formula uses the number 1000.
Publicly used statistics for goalies at the season level are descriptive statistics: in 2023-24, Joel Hofer (G, STL) had a Goals Against Average of 2.65 and a Save Percentage of 0.913. In my mind, his important statistics are 1628.6 minutes of ice time and 10.48 SVAA.
Just before midnight, the penny dropped. I could convert both TOI and SVAA to the number of points an average team would get based on those two statistics. This would create a number that was fairly based on a goalie’s TOI and SVAA while eliminating the ‘data contamination’ caused when a goalie plays for a very good or a very bad team.
GxPts: Step 1 – TOI – Potential Points (PPts)
TOI is used to determine Potential Points, the number of standing points a team could get in the amount of time a goalie was on the ice. The conversion rate is 2 points per 60 minutes. Thatcher Demko (G, VAN) played 3016 minutes this season. Dividing 3016 by 60 and multiplying by 2, Thatcher Demko has 100.5 Potential Points.
GxPts: Step 2 – SVAA – Goalie Win Percentage (GWP)
Step 2 calculates the winning percentage an average team would have with a specific goalie in nets. This allows GxP to evaluate goalies on an equal footing, whether they play for Carolina or San Jose.
The starting point for the average team is that they score and give up 2.75 goals per 60 minutes. The goals-against rate for this average team is adjusted based on a goalie’s SVAA data. The better a goalie’s SVAA, the lower the team’s goals-against rate, and the higher their win percentage will be.
Demko’s SVAA was +20.59, so his SVAA60 (saves above average per 60 minutes) is +0.41. Subtracting +0.41 from the 2.75 goals per 60-minute starting point, the average team gives up 2.34 goals per 60 minutes (2.75 – 0.41).
With Demko in nets, the average team would have a score of 2.75 to 2.34. Demko’s Goalie Win Percentage for 2023-24 is 58%.
GxPts: Step 3 – Goalie Expected Points
Demko’s GxPts is calculated by multiplying his Potential Points (100.5) by his Goalie Win Percentage (58%), producing a value of 58.3. I then add 0.1 to produce the official GxPts for Demko: 58.4. The reason for the extra 0.1 will be explained in the Career GxPts Chart section. And, in case you are wondering, a goalie’s GxPts could never be negative.
GxP Categories
A goalie’s GxPts value will put him in one of six GxP categories. Each category has a range of 16 GxPts. GxP-CallUp is for goalies whose GxPts is between 0.0 and 15.999; GxP-Fringe is for goalies whose GxPts is between 16.0 and 31.999; GxP-Elite is for goalies whose GxPts is 80.0 or more (the top category has no upper limit).
The table below shows the categories by name, as well as the counts of goalies that have landed in those categories since the 2007-08 season.

Career GxPts Chart
Skaters have Career Productivity Rating and Career Value Rating charts that visually represent their accomplishments over their careers. The Career GxPts chart does that for goalies. It displays the GxPts a goalie earned in each of his seasons. Braden Holtby’s career is shown below; it will help me explain a couple of features of the chart.
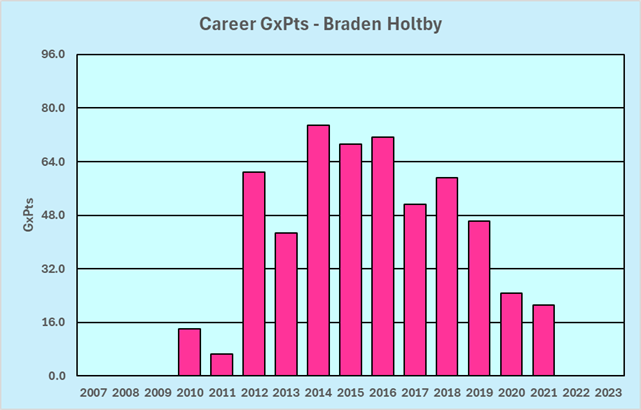
The vertical scale is GxPts: the higher a bar goes, the better season a goalie had. The horizontal scale is seasons, running from 2007-08 through 2023-24: this is the “rich-statistics era”, the only seasons that have the data necessary to calculate GxPts.
When a goalie doesn’t play in a season, there will be no bar. Holtby first played in 2010-11 and last played in 2021-22. Goalies who played only a couple of minutes in a season could get a GxPts of 0.0 (without the extra 0.1 that is added), which would make it look like they didn’t play at all: the 0.1 is added so that there is visual proof he played in a season.
The gridlines going across the chart identify the GxP categories. The bottom slice of the chart is the GxP-Callup category while the top slice is the GxP-Elite category. Holtby had three GxP-Star seasons and three GxP-Number1 seasons. He was the main goalie on his team from 2012-13 through 2019-20.
Evaluating GxP: Demko vs. Stolarz vs. Fleury
As I said earlier, the problem with a goalie rating system is how it handles goalies who play significantly different amounts of time, especially when the less-frequently used goalie has better descriptive statistics.
Demko, our GxP exemplar, had twice as much ice time as Anthony Stolarz (G, FLA), but Stolarz had a much better SVAA60. The following table shows the statistics that lead to their GxP scores (SVAA60 is shown as SV60 to reduce the width of that column; PPts is Potential Points and GW% is Goalie Win Percentage).

Demko rates ahead of Stolarz in GxP, 58.4 to 34.2, because Demko played so much more.
To throw a bone to both of the fans of Anthony Stolarz, this next table shows how he compares to another goalie who played a good amount more than he did.

Despite playing only two-thirds as much as Fleury, Stolarz has a better GxP due to his much better SVAA60 data. Now, having set the stage, it is time to look at this year’s top goalies.
Top Goalies of 2023-24
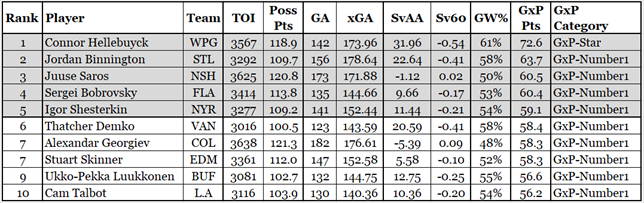
The table above shows the top ten goalies in the league according to GxP.
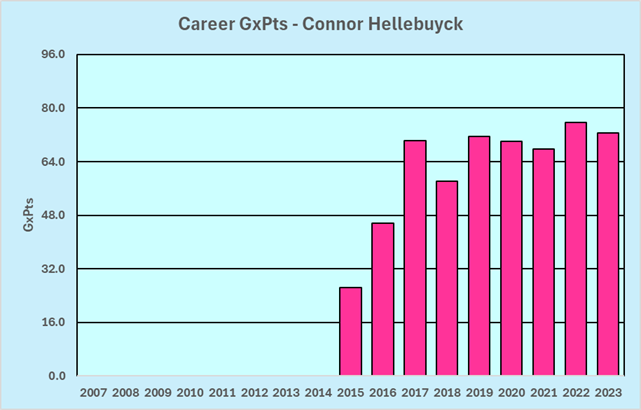
At the top, you see that Hellebuyck is the only goalie this season in the GR-Star category (GxPts between 64.000 and 79.999). He has been the best regular-season goalie in the league these last five seasons, and he has been remarkably consistent from season to season.
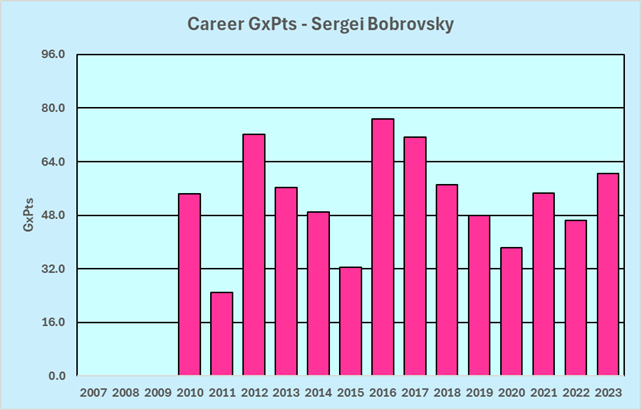
I said he was remarkably consistent because most goalies tend to fluctuate in their level of performance from season to season. Sergei Bobrovsky’s chart shows a typical level of fluctuation for a goalie.
In second place in 2023-24 was Jordan Binnington (G, STL), who was very close to being in the GxP-Star category. His high rating might surprise some people, as St. Louis was not a playoff team. Binnington’s play was worth approximately 12 standing points for the Blues: without him, St. Louis would have been in the Ottawa-Calgary-Seattle area of the standings.
Juuse Saros (G, NSH) ranks just ahead of Sergei Bobrovsky (G, FLA) even though Saros gave up more goals than expected. Saros played 211 more minutes, which gave him more Potential Points, which resulted in him nosing out Bobrovsky (60.5 to 60.4).
I decided not to comment on Ukko-Pekka Lukkounen (G, BUF) because of the near certainty that I would misspell his name.
GxP Issue: The Boys from Boston
Why on earth are the Boston goalies ranked so low (17th and 21st)?
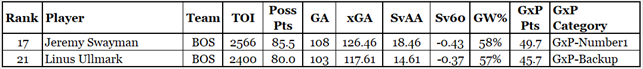
Jeremy Swayman and Linus Ullmark both played very well and their SVAA60s are among the top in the league. Their lower-than-expected rating was caused by their ice time. The average top-ten goalie from 2023-24 played 3339 minutes: Swayman played 2566 minutes and Ullmark played 2400 minutes. The average top-ten goalie in 2022-23 had 111 Potential Points, the Boston goalies had 85.5 and 80.0.
I will admit that, for these two gentlemen, the ratings do them a slight disservice. They are being used in a non-traditional format (their team had no dominant goalie) and the rating formula was developed using seventeen seasons of almost completely traditional format data (where each team had a dominant goalie).
I maintain that their GxP ratings are accurate, as neither of them played as much as many other goalies on other teams. While probably would have been the dominant goalie on his team if the other goalie was not his teammate, a proper rating system evaluates players on what they did instead of what they might have done.
GxP Issue: Carolina
The Carolina Hurricanes gave up the fourth-lowest number of goals last season, yet their top goalie, Pyotr Kochetkov, ranked 27th in GxP (GxPts 40.4). How does that possibly make any sense? A few factoids are behind this rating.
One: Kochetkov played 2,371 minutes, while the average #1 goalie played 3,001 minutes. Kochetkov has only 79 Potential Points.
B: Kochetkov’s SVAA60 is 0.05, having given up 92 goals compared to 94.13 expected goals. He is close to an average goalie in terms of SVAA60.
Thirdly: the rating system rates goalies on how they would do on an average team. Carolina is far from an average team, especially defensively: they are fine masters in the art of shot suppression. Carolina’s extremely good goals against average is caused by the team’s commitment to defense, not by great goaltending.
Kochetkov’s rating makes sense. He didn’t play a ton and he conceded about as many goals as expected.
GxP – Who it Helps, Who it Hurts, What it Eats For Breakfast
GxP helps goalies who get a lot of ice time because those goalies start with high Potential Points values. An example of such a goalie is Joonas Korpisalo (G, OTT). Korpisalo is 22nd in the league in GxP, and I doubt there is a single fan in Ottawa who believes there were ten teams in the league where all their goalies are worse goalies Korpisalo. Korpy is rewarded for having played a lot, rather than for having stopped a lot of pucks.
Why did Korpisalo play so much? Well, it is a bad strategy to play an entire game with an empty net, so somebody had to play goalie. Was he the best goalie available in Ottawa? Forsberg’s SVAA was ever so slightly better, but he also missed games because of injuries.
GxP hurts goalies who have good SVAA data but who don’t play a lot. Stolarz (G, FLA) is a prime example of such a goalie: had he played 3000 minutes with the same SVAA data he would have easily been a top-ten goalie in 2023-24.
It should be noted that Stolarz could have been receiving beneficial starts that were artificially inflating his SVAA data. When the main Florida goalie needed a night off in the team’s next two games, which goalie do you think would get to play against the lesser team? More often than not, it was probably Stolarz. He had the advantage of playing mostly against non-playoff teams while playing with the forwards and defensemen of the Florida Panthers.
GxP neither helps nor hurts goalies who play on teams with terrific defense, such as Pyotr Kochetkov of the Carolina Hurricanes. Their GxP data may not seem to match their goals-against numbers, but GxP looks at how a goalie would play for an average team with an average defense. Kochetkov has very good traditional statistics because he played for Carolina; if he played in Ottawa, his traditional statistics would be worse.
For breakfast, GxP has two eggs easy over, bacon, hash browns, and two slices of whole wheat toast. It drinks its coffee black (no cream and no sugar) as it is trying to watch its weight.
Summary
Is the GxP system perfect? Of course not. Those who seek perfection in any moderately complex endeavor is doomed to a lifetime of disappointment, as they will never achieve it.
Does it do a good job? The key evaluation of any statistic that is used to rate players is whether the results subjectively make sense.
Looking at 2023-24, if the GxP process had Joonas Korpisalo (G, OTT, 22nd in GxP) or Ilya Samsonov (G, TOR, 34th in GxP) in the top five goalies in the league, it would be obvious that the process was flawed. Looking at careers, if your process says that the best goalie since 2007-08 was Tuukka Rask, you’d have to go back and improve its formulas.
That GxP identified Hellebuyck as this season’s best goalie and that it identified Lundqvist as the best goalie ever is subjectively correct: most people would make the same statement without doing a statistical analysis. Not everybody, but most.
GxP does a fine job of identifying the top talent, and it does a perfectly good job of rating the rest of the goalies as well.
Related Articles
Introduction to Productivity Rating
Introduction to Value Rating
Introduction to Goalie Rating (the earlier goalie rating system I will no longer use)