As I was working on an article about Toronto’s historic strengths, I idly thought about the rest of the team. Rather than look at the top three forwards and top two defensemen, I could look at the rest of a team’s skaters. Hence, this article.
Historic Depth – What am I Talking About?
In terms of history, I looked at data from the seasons 2016-17 through 2023-24. The depth of a team was identified as all skaters who were not one of the top three forwards or top two defensemen for a team in a season.
Identifying the Depth Players
Rather than using a pure Productivity Rating Score (PR-Score), as I did when identifying the top five players of a team, I used a slightly modified version of PR-Score for depth. Modifications were necessary to evaluate a group of players on a team.
The modification was the removal of the “add-on”, where 0.5 is added to the PR-Score after all of the stat-based calculations have been done. In 2023-24, Erik Gudbranson’s PR-Score was 5.9254 before the add-on, so his official PR-Score was 6.4254. The add-on exists so that players will not get negative ratings, something that could happen if a player played a small number of minutes and had a couple of giveaways. When you consider how massively talented any NHL player is a negative rating would be insulting.
The reason I removed the add-on for the depth study was that teams have used vastly different numbers of players at forward or defense in a season. When looking at the strength of a team, every team had three forwards and two defensemen.
In 2023-24 Dallas used only fifteen skaters at forward, while Columbus dressed 27 forwards. This gave Dallas and Columbus twelve and 24 depth forwards, respectively. This would have given Columbus a 6.0 advantage in total PR-Score (12 times 0.5) over Dallas had pure PR-Score been used for the total PR-Score of the depth forwards. The Blue Jackets had good depth at forward last season, but including the add-on for all 24 of their depth forwards would have improved their rank from 6th best to 2nd best. It was not logical to “reward” a team because they churned through players at a position, so the add-on was removed.
Now let’s take a look at the chart that will be used.
The Hockey Rink Chart
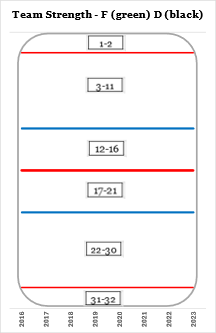
The background of the Hockey Rink Chart gives the impression of a hockey rink. You can see the boards (grey line around the body of the chart), goal lines (red lines at the top and bottom), blue lines and the centre red line.
The numbers in the boxes show the rank a team must have to get a data point into the area, from one to two at the top of the chart (best teams) to 31 to 32 at the bottom (worst teams).
A team’s depth at forward across the seasons will be shown with a green line, while its depth at defense will be shown with a black line.
All data points represent a team’s unit’s standing in a specific season, compared to other teams in the league that season.
The chart on the left is the default Strength chart: the Depth chart will have a yellow tint to the background area, so as to make it a little easier to differentiate between the two charts.
Toronto Maple Leafs – Strength vs. Depth
It is appropriate that the first team section in the Depth article goes to the Maple Leafs, as it was a discussion with one of their fans that led to the “Hockey Rink Chart.” Below are their Strength and Depth charts.
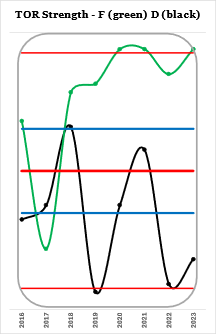
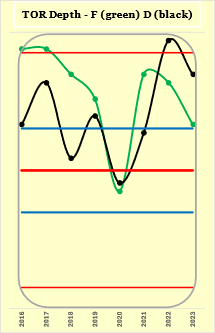
Why do the black and green lines follow different paths in the two charts? Shouldn’t a team’s depth and strength be similar, he asked rhetorically? There is no reason a team’s depth and strength should be similar, as they represent two different sets of players.
These charts show us that, over the last six seasons, Toronto’s strength at forward has been great and their depth has been well above average (except for 2020-21). We can also see that Toronto’s strength at defense has been largely below average while their depth has been above average. The difference between strength and depth in defense at Toronto has been exceptionally large over the last two seasons.
Toronto’s best two defensemen in 2023-24 were Morgan Rielly and TJ Brodie. 27 other teams had a higher-rated #1 defenseman than Morgan Rielly; eight other teams had a higher-rated #2 defenseman than Morgan Rielly. While their top two defensemen weren’t stellar, Toronto’s other defensemen were very good (compared to the league).
New Jersey Devils – Synchronization
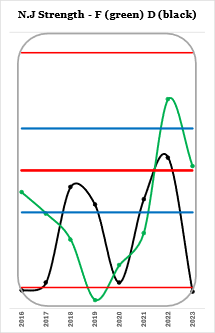
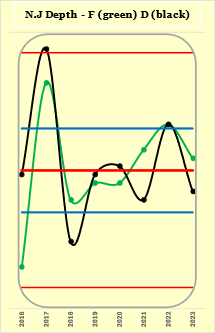
Just as there is no reason for a team’s strength and depth ratings to be similar, there is also no reason for their forwards and defensemen to be similar.
The Devils, however, have had a consistent balance between their depth forwards and depth defensemen, showing a level of coordination that the Radio City Rockettes might envy.
Balance doesn’t mean power. In 2017-18 the Devils had great depth at forwards and defense. In 2018-19 they had below-average depth at forwards and defense. In both years, their depth was balanced (great the first season, below average the next).
Vancouver Canucks – Asynchronization
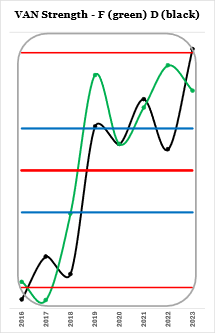
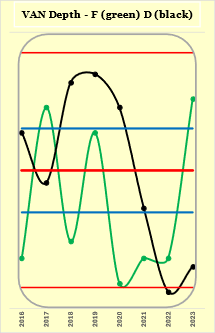
Vegas Golden Knights – How to Expand
The inaugural season of the Vegas Golden Knights produced unexpectedly good results. Expansion teams, made up of other teams’ castoffs and a collection of misfits, are not expected to succeed for seasons. Vegas’s expansion draft rules were much more expansion-team-friendly than those for all prior expansion teams.
Ottawa, for example, took four full seasons after expansion to win 51 total games (51-224-23). Vegas won 51 games in their first season (51-24-7).
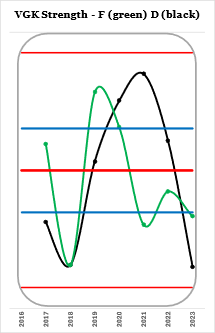
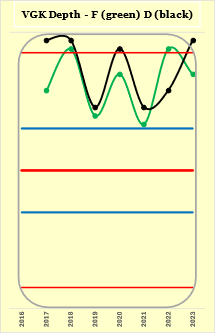
While Vegas’s first season was impressive, what is really impressive is how they set themselves up for the future. The Golden Knights have been in the top ten in depth at forward and defense every season they have played.
Carolina Hurricanes – Defensive Depth
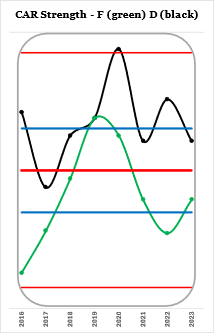
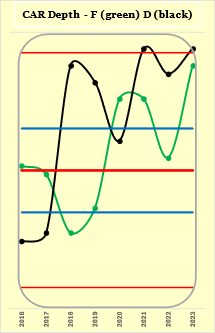
Vegas and Toronto had higher eight-season ratings for depth of defensemen, but they’ve already been reviewed in this article. Carolina is in third place.
Being among the best at depth of defensemen is not necessarily related to having low goals against. Over the last eight seasons, Carolina is 2nd in GA60 (2.65), and Toronto 17th (2.91).
There are three reasons why Carolina’s GA60 is near the top of the league while Toronto’s is in the middle of the pack, even though Toronto’s depth at defense has been slightly better.
First, there is strength in defense. Carolina’s strength has been much better than Toronto’s.
Second, there is the way a team plays, as evidenced by Expected Goals Against (xGA). Carolina’s xGA60 is 2.63, Toronto’s is 2.81. Carolina’s game-level tactics result in their opponents having fewer scoring chances, and so their opponents score fewer goals.
Third, there is the guys in the nets. Over the eight seasons being evaluated for depth, Carolina has had better goaltending than Toronto. Below are the “Goalie Expected Points” charts for Carolina and Toronto. The higher the bar in a season, the better the goalies were.
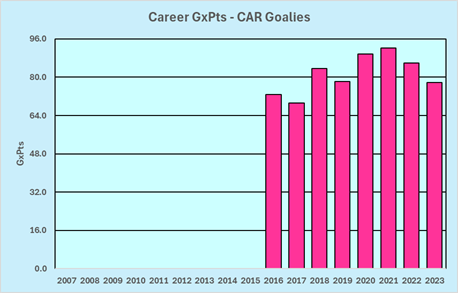
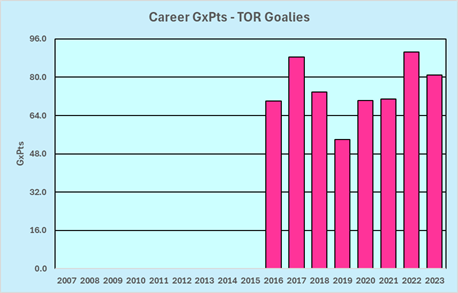
Having great depth at defense does not always translate to having a great defense. Just ask the Toronto Maple Leafs.
Tampa Bay Lightning – Depth at Forward
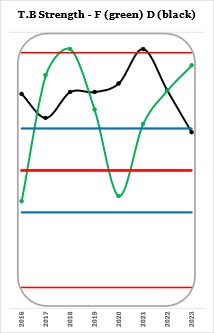
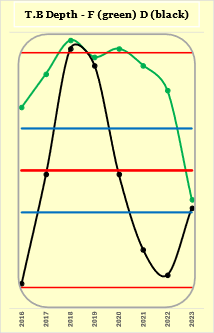
Even though their forward depth plunged last season, the Lightning have had the best forward depth over the last eight seasons.
In case you are wondering, Tampa’s two Stanley Cups came in 2019-20 and 2020-21. They had their best team depth in 2018-19, as well as great strength, yet lost four straight games in the first round of the playoffs to Columbus.
Chicago Blackhawks – Depth That’s Ankle-Deep
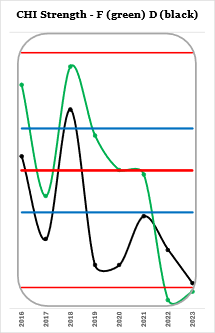
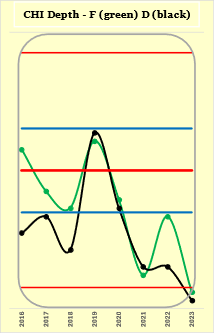
In 2023-24, both in terms of strength and depth, it looks like Blackhawk forwards and defensemen were driven through the boards due to a check in the back from Matt Rempe (NYR, currently suspended yet again, allegedly D).
Chicago has taken the idea that a rebuild requires a team to have a few bad years the way the Pope takes to the Bible.
How many years are they from being competitive again? At the time of this writing, they are in last place in the NHL, so it isn’t going to happen any time soon.
Summary
This article, and the article on Toronto’s historic strength, were born while a sport friend of mine was complaining. He said that Toronto hadn’t had strong defensemen in years and you can’t win the Stanley Cup without strong defensemen. He was right about Toronto but wrong about the Stanley Cup.
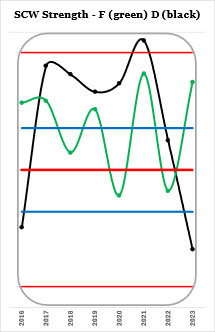
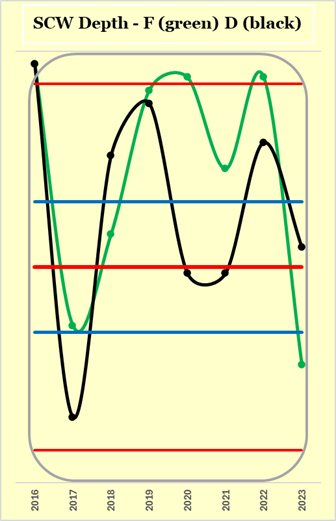
Here are the Strength and Depth charts for Stanley Cup Winners (SCW). Notice how some seasons the Stanley Cup was won by teams with poor strength at at defense (2016-17, 2023-24) or poor depth at defense (2017-18).
The next time you hear somebody say something like “Stanley Cup winning teams always have strong defense”, just be aware they are probably voicing their favourite opinion (defense is vital!) instead of using critical thinking. A lot of people use examples to support their opinion, stressing points in time that agree with their opinion and ignoring or explaining away points in time that go against their opinion. They use data the way a drunkard uses a light pole: for support rather than for illumination.
The only thing all Stanley Cup winning teams always do is win sixteen playoff games.
Related Articles
Introduction to Productivity Rating
Productivity Rating Calculation Details
Toronto Historic Strength
