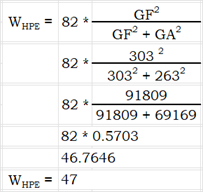
The Hockey Pythagoras Estimate (HPE) is a series of formulas that produce an estimate of standing points a team should get in an 82-game season given the goals they scored and the goals they conceded. It is a variation of the baseball’s Pythagorean Win-Loss formula which predicted a team’s win-loss record based on runs scored and runs allowed, which I first discovered while reading the Baseball Abstracts of Bill James back in the 1980s.
I have used variations of HPE in many articles, using slightly different processes as I tweaked the method. It has previously been referred to as the “Pythagorean Points Predictor” or “Pythagorean Method – Hockey Variant.” I am hopeful that, with the tweak I recently made, the process will be stable for the foreseeable future.
This article documents the HPE formulas and shows how accurate the predictions are (spoiler alert: they are quite accurate).
The More the Merrier
The comparison data will come from fourteen 82-game seasons played since 2007-08 (see footnote 1), which consists of 428 teams. Data from seasons shortened due to pandemics and lockouts were not used because they would make the accuracy of HPE higher: it’s more likely that a prediction would be within four standing points in a 56-game season than it is in an 82-game season.
HPE Calculations in Excruciating Detail
While the process projects win, loss and tie counts for a team, let me stress that the purpose of HPE is to generate POINTS. The wins, losses and ties are merely steps to get to points. It’s nice that those interim data points happen to be realistic, but not necessary.
Since the details will be excruciating, the example team will also be excruciating: the 2023 Toronto Maple Leaf Hockey Club. It scored 303 goals and conceded 263.
The first step is to calculate wins, using the same formula that Bill James used in his Baseball Abstract all those decades ago. In the final step of this calculation, the fractional result is rounded to a whole number.

The most recent fine-tuning of the standing-point prediction process involved calculating ties. Ties are set to 22% of wins, rounded to a whole number.

22% was used to estimate ties because it produced the right amount of points over the fourteen seasons. The total HPE for 428 teams was 38,969 points as compared to their actual total of 39,153 points (HPE is 99.53% of actual).
Losses are calculated for no other reason than to produce a W-L-T season record.

Finally, HPE is calculated as season points have been calculated since the NHL season of 1921-22 (see footnote 2): two points for a win, one for a tie.
Toronto’s HPE for 2023-24 is 104 points (47-25-10); their actual season saw them get 102 points (46-26-10).
Similar Inputs, Similar Outputs
The process did not use the team’s name in calculating a prediction, it solely used goals for and goals against. When two teams have very similar GF-GA data, they get the same HPE.

How Accurate is HPE?
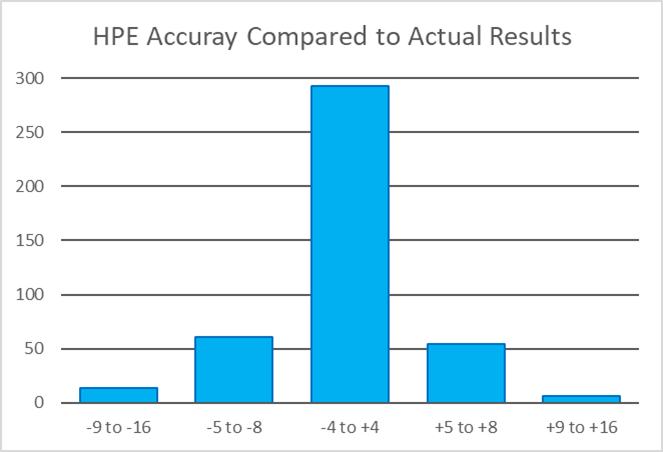
HPE is pretty darn accurate, as a statistician might say.

HPE is within four standing points of a team’s actual final points 68.5% of the time. For example, a team with an HPE of 99 will have had 95 to 103 actual points more than two-thirds of the time.
Most of the rest of the time, HPE is within eight standing points.
This level of accuracy is comforting. If the process was less accurate, there would be no reason to use it.
How Useful is HPE?

In 2022-23, the Capitals gave up just a few more goals than they scored. One would expect that they would have had close to an average NHL season, which would be 91 points. HPE indicates they should have had 89 points, but they ended up with only 80 points. What happened?
In games that were decided by two or three goals, Washington was 12-23. In games that were decided by four or more, Washington was 10-6. By winning more than their fair share of blowouts while losing more than their fair share of close games, the Capitals ended up with a worse record than their season-level goal-scoring data indicated.
The next season, Washington’s goal data was far worse: they went from 253-261 (-8) to 220-257 (-37). Yet they improved their record by eleven points, going from 80 to 91. HPE said Washington’s 2023-24 season should have resulted in 78 points. What happened?
Washington did the exact opposite of what they did in 2022-23. In games that were decided by two or three goals, Washington was 17-16. In games that were decided by four or more, Washington was 3-13. By winning their fair share of close games while losing more than their fair share of blowouts, the Capitals had a better record than their season-level goal-scoring data indicated.

Other Uses For HPE
HPE can also be used with expected goal data. The team-level differences between goal HPE (g.HPE) and expected goal HPE (x.HPE) can be very instructive. It can show teams that got worse results than they deserved, based on their play (Ottawa, for one). It will also show teams that got better results than they deserved, based on their play (Winnipeg, for one).
HPE should not be used with Corsi or Fenwick or shot data. The problem with shot-level data is that shots have different values. A shot from ten feet in front of the net is far different than a shot from the blue line. And why even bother with shot level data when expected goal data is a few columns to the right (at naturalstattrick.com)?
Summary
This article shows how HPE is calculated and how accurate HPE is. HPE will be used in a couple of upcoming articles, so this article makes those articles shorter by having the technical information in one place.
Related Articles
Pythagorean Method to Estimate Standing Points
Footnotes
- 2007-08 was used as the first season because it is the first season for which detailed player statistics exist; it is the typical “first season” at Stapled to the Bench.
- I cannot be positive that two points for a win and one point for a tie started in 1921-22. The online information for that time period is … imprecise. According to an ESPN article “Overtime was introduced in the NHL in 1921. Overtime began as an additional 20-minute sudden-death period of five-on-five action before being trimmed to 10 minutes in 1927 …”. Rules changed over time, “including the elimination of sudden-death rules (1928) and the elimination of overtime altogether in the regular season (1942).” Ties were possible. It is still unclear whether Ottawa finished the season with 30 points (14 wins, 8 losses, 2 ties) or whether their record was 14-8 (ignoring ties).
