
I was wondering which teams benefited the most from their power play and penalty kill special teams in the regular season. In this article I will rank all NHL teams by their special teams results and speculate about the impact those results had on the standings.
The Power Play Percentage (PP%) statistic will only be used to confirm that my measures aren’t completely out in left field. As you’ll soon learn, I don’t like PP%.
Power Play Percentage
I’ll put my cards on the table right at the start: I’m not a fan of power play percentage (PP%). It has a strong advantage: most fans know whether a team’s PP% is good or bad. The league average is around 20% so a higher value than that is good and a lower value is bad.
Some of my problems with PP% are a little nitpicking in nature. Let me show you my issues with a series of questions.
How does a team’s power play percentage compare to their even-strength percentage?
If a team gets a power-play with one second left in the game, does that count as a power play opportunity?
If a team scores two goals during a major penalty power play, is their PP% for that penalty 200% (two goals in one opportunity)?
The answers to those questions are: there is no even-strength percentage statistic; yes, a power play with one second left in the game counts as an opportunity, and; scoring two goals during a major penalty would produce a PP% of 67%. For major penalties, the team is credited with one more opportunity than the goals they scored during the penalty. It’s an incredibly stupid rule. It is like crediting a batter with an extra plate appearance if he hits a double, to keep his slugging percentage at or below 1.000.
The issues I have with PP% (and, by extension, PK%) gave me a reason to create a different statistic. It isn’t much of a creation: it was pretty much just sitting there.
Special Teams Goal Differential (STGD)
A good power play scores goals; a good penalty kill gives up goals sparingly. A good team should score more power play goals than they give up. In order to determine the impact of special teams play on the standings, I need to know how many goals they scored and how many they conceded.
A good measure of special teams should be had by taking each team’s power play goals and subtracting the penalty kill goals they gave up. And by properly crediting or debiting the short-handed goals.
Where the league average for PP% is around 20%, the league average for STGD is 0. Every time a special-teams goal is scored by one team, the other team is scored on. Is +15 among the best? You need to see the data from all teams to figure that out.
I’ll use a randomly selected team to explain the Special Teams Goal Differential (STGD) statistic. The random team is the Tampa Bay Lightning. Really, it was a random selection. In excel, the function randbetween(1,32) returned 8, which is the row Tampa Bay was on.
Tampa had a good power play percentage, humming along through the season at 23.9%. On the penalty kill, they were just a touch better than average at 80.6%. Since they were better than league average on both the power play and the penalty kill, they should have more special team goals for than goals against.
On the power play, Tampa scored 62 times and conceded 5 goals. On the penalty-kill, they scored 7 shorties and gave up 49 goals. Their STGD is the sum of the goals their special teams scored minus the sum of the goals scored against them.
STGDTB = 62 – 5 + 7 – 49 = +15
On the negative side things is Los Angeles. The Kings had a below average penalty-kill (76.7%) and were 27th on the power play (16.1%).
STGDLA = 40 – 9 + 11 – 53 = -11
Disclaimer: When I say I created this statistic, I mean that I didn’t find it when I searched for it on the interweb. It is incredibly likely that somebody else has done this before me, and I just didn’t stumble on the right search phrase to find it. At slindenberg.com they combined PP% and PK%, which is a similar idea. Several sites listed all manners of special teams statistics but didn’t calculate STGD.
The truth is out there, somewhere.
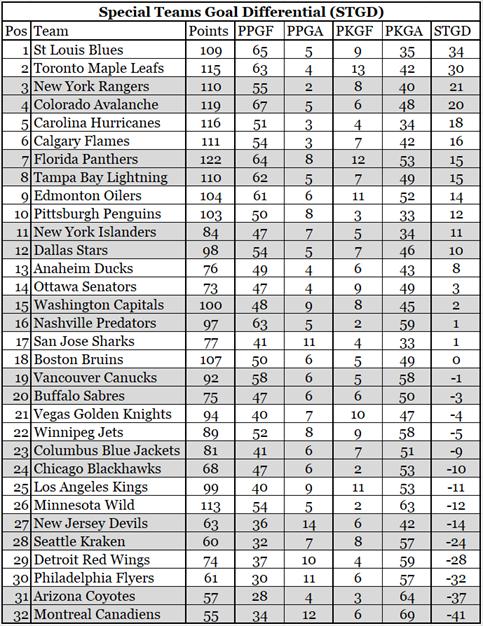
As you can see, the top ten teams in Special Teams Goal Differential all had more than 100 points on the season: having good special teams is an asset in the regular season. There are a couple of outliers, most notably in the 25th and 26th positions in the rankings. Los Angeles and Minnesota, two teams with good regular season records, allowed more special teams goals than they scored.
Impact of Special Teams on Regular Season Standings
There is a relationship between standings points, goals for and goals against. A team’s standing points can be reasonably predicted from its goals-for and goals-against. It is the “Pythagorean method”, and I believe Bill James was one of the first people to popularize its use. Now, Bill James wrote about baseball (and he did it extremely well), and baseball doesn’t have regulation ties, so the basic formula needs a tweak to work well in hockey.
The normal Pythagorean formula is Wpct = GF2 / ( GF2 + GA2 ): winning percentage is [ goals for squared ] divided by the sum of { [ goals for squared ] and [ goals against squared ] }. A team with an average score of 4-3 would be expected to have a winning percentage of Wpct = 42 / ( 42 + 32 ) = ( 16 / ( 16 + 9 ) ) which equates to 64%.
It is necessary to make a minor adjustment to this formula because baseball doesn’t reward a team for going to extra innings, but hockey rewards a team for going to overtime. Multiplying Wpct by 1.11 provides the best fit: a team with an average score of 4-3 would expect to get 71% of their possible standing points (116 .5 points in an 82-game season).
How well does that formula work? In 2021, 26 of 32 teams were within six points of the prediction. It works very well.
This formula indicates that a change of three goals over the season is worth one standing point. As an example, let’s look at the prediction of Arizona. Arizona scored 206 goals and gave up a miserly 309. The formula predicts they would get 56.01 points; they actually got 57 points. If Arizona had scored 209 goals (three goals more), their predicted points would be 57.14. Therefore, an improvement of three goals is worth about one point. Using that estimate, we can see what would have happened had a team broke even on their special teams play. How many points would Toronto have had if they weren’t plus-30 in their special teams? How many points would Montreal have had if they weren’t minus-41?
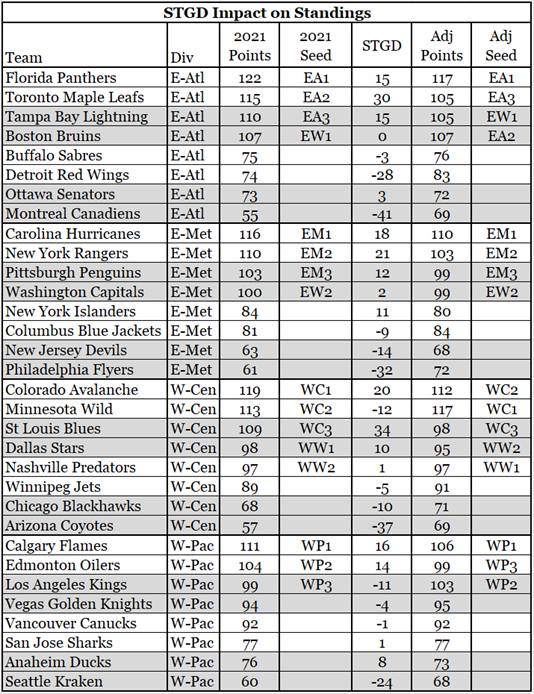
The table organizes teams by division and by regular season standing points. Their actual playoff seeds are in column four: Edmonton was the number two seed in the (Western) Pacific division, and Dallas was the number one wild card team in the West. The next two columns show the STGD for each team, and the number of points they would have had, had they broken even on special teams’ goals. The final column shows the playoff seed a team would have had based on the adjust standing points: Edmonton would be the number three seed in the Pacific and Dallas would have been the number two wild card team.
Summary
Who benefited the most and the least from their special teams play? St. Louis and Toronto benefited the most from the special teams play during the regular season, while the Flyers, the Coyotes and les Canadiens were hurt the most by their special teams.
Special teams play had no impact on which teams made the playoffs, but it very likely had an impact on the playoff seeds of some teams. Having game seven at home in a playoff series is a significant advantage.
In the East, Toronto’s special team play gave them the number two seed in the Atlantic, allowing them to host the seventh game of their series with Tampa Bay. Had their special team play been a break-even proposition, they would have been the third seed with Boston having the advantage of hosting a possible game seven. This would have resulted in a different team eliminating Toronto in the first round.