
This article is one of two on the impact of players on their team. Impact of Top Two Defensemen was written first and meant to be read first, but that it isn’t strictly necessary. The articles are a bit repetitive – a good deal of copy-and-paste is involved, especially in the introduction and study method sections.
It is obviously a good thing for a team to have great forwards. Great players make their teams winners. Logically, having a great forward on your team should result in more standing points, which will give your team a greater likelihood of making the playoffs and a better seed in the playoffs. That assumption is generally correct.
In this article, I’ll focus on forwards. Specifically, I’ll focus on the top three forwards on each team. The three forwards may not be a “line” and may not actually play much with each other.
Study Method
I’ll use Productivity Rating (PR) to identify the top three forwards on each team in each season. (For more information on PR, see the article Introduction to Productivity Rating.) Forwards who were traded mid-season will have their season PR-Score proportionally allocated to each team he played for. That is, if Robby Clobber had a PR-Score of 4.4000 and played 20 games with Detroit and 60 with Seattle, he’d have a PR-Score of 3.3000 for Seattle while his Detroit PR-Score would be 1.1000.
For each team, I will note the PR-Category of their top three forwards. For example, in 2014 the New York Rangers top three forwards were Rick Nash, Derick Brassard and Mats Zuccarello. Nash had a PR-Star season, while Brassard and Zuccarello were PR-First5.
I will also use the points each team gained in the regular season. The 2014 New York Rangers had 113 points. For the lockout/pandemic shortened seasons, I’ll calculate how many points each team would have had in 82 games. Minnesota had 55 points in 48 games in 2012, which becomes 94 points in this study (55*(82/48)).
Putting all the information together for one team in one season: in 2014, the Rangers’ top three forwards were PR-Star, PR-First5 and PR-First5; the team had 113 points. In total, there are 456 data points (team-season, top three forwards PR-Categories, standing points).
Top Three Forwards: An Overview
The top PR category is PR-Elite. No team had three forwards who were PR-Elite. The team that came the closest to that was the 2020 Edmonton Oilers and the Vancouver Canucks in 2009, where Henrik Sedin and Ryan Kesler had PR-Elite seasons and Alexandre Burrows had a PR-Star season. Burrows? Daniel Sedin missed 19 games, Burrows missed none, so Burrows had the higher PR.
The most common top-three combinations were: PR-Star and two PR-First5 (111 times); three PR-First5 (96 times). Together they account for 45% of the data.
The least common top-three combination (that actually occurred) was PR-First5 with two PR-Regulars. The 2016 Buffalo Sabres was that team, with Ryan O’Reilly being the PR-Star while Jack Eichel and Evander Kane the PR-Regulars.
Finally, the lowest combination was three PR-Regulars, occurring ten times. These teams best forwards were essentially second-line forwards. One exemplar of this combination was the 2020 Detroit Red Wings with Luke Glendenning, Dylan Larkin and Vladislav Namestnikov.
I’m going to switch to using the PR-Category number (which actually does exist) rather than the text in some of the tables. PR-Elite is 5, PR-Star is 4, PR-First5 is 3 and PR-Regular is 2. For completeness’s sake, PR-Fringe is 1 and PR-CallUp is 0. It turns out that [543] is shorter than [Elite-Star-First5].
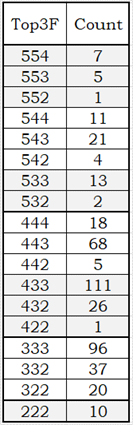
This first table shows the distribution of top-three forward combinations. As an example, there were 21 teams whose top three forwards were PR-Elite, PR-Star and PR-First5: [543].
Since three players are involved, there are more unique combinations than for two defensemen. And, because there are more unique contributions, there are more small groups. Any group size that is below ten will not have their calculated statistics displayed, because the results are unreliable. This will result in some “collapsing”: contiguous cells will be combined and their combined statistics will be displayed.
One clear picture of impact comes from looking at a team’s top forward.
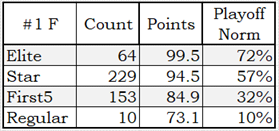
Teams whose top forward had a PR-Elite season averaged 99.5 points in the standings. These teams hit the “playoff norm”, which means they had 94 or more points, 72% of the time.
This table shows that the better your best forward is, the more points you’ll have in the standings and the more frequently you’ll make the playoffs.
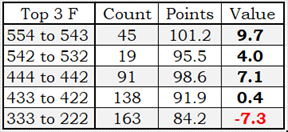
Now to the focal point of this article: the impact of a team’s top three forwards. The following table shows that impact. As noted earlier, some collapsing how been done to ensure that each data row contains at least ten teams.
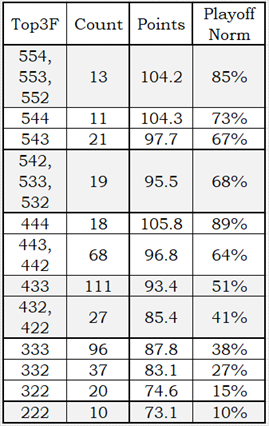
Teams with two PR-Elite forwards ( [554], [553] and [552]) averaged 104 standing points and hit the playoff norm 85% of the time. You’d think it should be 100%, but you might have forgotten about the Edmonton Oilers. The 2018 Oilers had Connor McDavid, Leon Draisaitl and Ryan Nugent Hopkins, a [554] combination, and they finished with 79 points. There is a big difference between a strong line and a strong team.
The data shows it is good to have three strong forwards. Teams where all three forwards are PR-Star or better average 104.2 points and hit the playoff norm 81% of the time.
Looking at the rows for teams whose top forward is a PR-Star (the [4xx] rows), the quality of the other two forwards matters. The better the quality of those two guys, the more likely the team will be successful.
Teams whose best forward is PR-First5 (rows that are [3xx]) suffer in the standings and don’t usually make the playoffs. Teams whose three best forwards are PR-Regulars really suffer in the standings, and rarely make the playoffs.
The one team that made the playoffs in the [222] group was the 2010 Nashville Predators, whose top three forwards were David Legwand, Patric Hornqvist and Martin Erat. All three of them were quite close to PR-First5. Both Legwand and Erat missed 18 games. The team’s top two defensemen were Shea Weber (PR-Star) and Ryan Suter (PR-First5), and each of those guys were at the very top of their PR categories. It was an adequate team whose players had lower PR-Scores due to injuries, or who just missed being classified higher.
Results
It is difficult to definitively state the value of the top three forwards on a team. The problem is: their value compared to what? I will compare them to the league average (91.5 points per team per season).
Another problem is that hockey is a team game, and the deciding factor for many teams isn’t their top three forwards, but rather it’s their top two defensemen, or their second line or their second defensive pair or their sieve of a goalie.
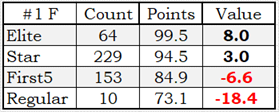
It is easy to calculate and display the value to a team of its top forward. The better a team’s best forward, the more points they get in the standings.
Looking at the top three forwards on a team, the results are as expected. The better the total quality of the top three, the better the team results. The “break-even” point is having one PR-Star forward with two PR-Regular (or worse): [422]. Teams whose top three are at or above [422] tend to get more points in a season, while teams below [422] tend to get fewer points in a season.
Surprise Ending I was working on the top two defensemen and top three forwards articles at the same time. At one point, I thought I had mistakenly copied a table from the defensemen article into the forward article. I hadn’t.
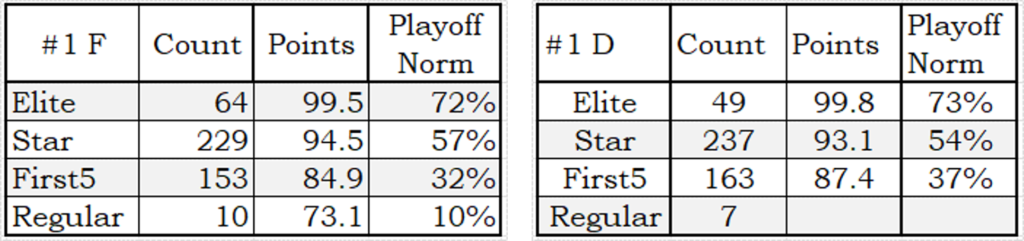
The average standing points and playoff norm percentage are extremely similar. What matters is the quality of a team’s best player, not his position. An elite defenseman has the same value as an elite forward. A star defenseman has the same value as a star forward. This surprised me. Going into the study, I thought it would show that great defensemen were “more valuable” than great forwards, and they aren’t. It’s important to have an Elite player, regardless he is a forward or a defenseman.