
There are two minutes left in the game and your team is ahead 3-2. A faceoff is going to be held in your team’s defensive zone. Do you know who is going to take the faceoff for your team?
Using Play-By-Play data purchased from BigDataBall.com, I’ll identify the players who were most likely to take the important faceoffs for their team in 2022-23.
Abbreviations for Statistics You Are About to Encounter
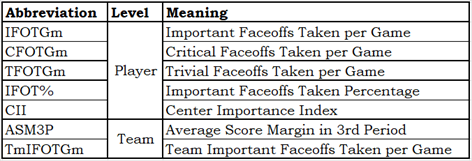
Definitions of these statistics will be given as they are introduced.
Defining Important, Critical, Trivial, and Standard Faceoffs
A faceoff is important if the game situation is important, which happens when the scoring of a goal could make a significant difference in the likely outcome of the game. Based on data from the article Score-Based Expected Points – The Value of a Lead, three types of important game times were identified: overtime; any time in the third period when the score is tied, and the last five minutes of the third period in a one-goal game. Faceoffs in those game situations will be considered “important”.
Critical faceoffs are a subset of important faceoffs. All overtime faceoffs are critical; in tie games, important faceoffs taken in the offensive/defensive zone are critical; for important one-goal faceoffs, those taken in the defensive zone of the leading team are critical.
Trivial faceoffs come about when the game is largely decided. Specifically: any time a team has a four-goal lead; any time after the first period when a team has a three-goal lead and any time a team has a two-goal lead and there is less than two minutes remaining in the game. Faceoffs in those situations will be considered “trivial.”
Faceoffs that are not defined above will be considered “standard”. For example, a second-period faceoff in a 3-2 game is a standard faceoff.
While powerplays and empty nets may make it more likely that one team will score, manpower arrangements have no impact on the categorization of a faceoff.
By the Numbers
There were 74,656 regular season faceoffs in 2022-23: 7,407 were important, 59,551 were standard and 7,698 were trivial. Per ten faceoffs, one was important, eight were standard and one was trivial.
Of the 7,407 important faceoffs, 4,862 were critical: roughly two in three important faceoffs were critical (65.6%).
Identifying Players Who Take Important Faceoffs
When looking for players who take important faceoffs, are we looking for quantities (faceoffs taken) or qualities (faceoffs taken per game played)? If we use quantities, players who play a lot will have an advantage over players who miss games. If we use qualities, players who take a small number of faceoffs could have an advantage over players who take many faceoffs.
I think that the taking of important faceoffs is a characteristic of a player, so a qualitative method is needed. A “qualified” qualitative approach will be used in order to ensure that only players who took a significant number of faceoffs in the season will be evaluated. To qualify for consideration, a player must have taken at least 410 faceoffs (five per scheduled game) in 2022-23: 139 players qualified.
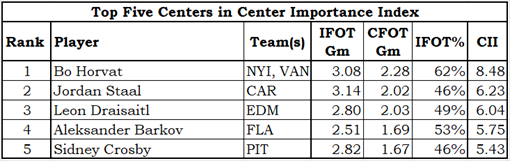
Sidney Crosby (PIT) took 230 important faceoffs to lead the league, and he will be our exemplar while the underlying data that determines “important faceoff takers” is explored.
Crosby happens to be 9th in trivial faceoffs taken (140) because he was also first in taking faceoffs of any type (1,845). Should the number of trivial faceoffs a player takes have any impact on his status as an important faceoff taker? No, it should not: the nature of unimportant faceoffs a player takes is, well, unimportant to determining his status.
To convert a number of important faceoffs into a qualitative figure, I will use Important FaceOffs Taken per Game played (IFOTGm). Crosby still leads the league at 2.80 IFOTGm, ahead of Bo Horvat (NYI, VAN) [2.70] and Elias Lindholm (CGY) [2.69].
What about critical faceoffs? Bo Horvat and Patrice Bergeron (BOS) led the league in Critical FaceOffs Taken per Game (CFOTGm) at 1.94, followed by Leon Draisaitl (EDM) at 1.91. Crosby was seventh with 1.70 CFOTGm.
There is one more thing to look at. Players do not have the same opportunities to take important faceoffs.
Team-Level Influence on Important Faceoffs
At the team level, there were significant differences in the number of important faceoffs they had. One team in particular had a very large number of important faceoffs last season. I’ll let you think about which team that was while I rattle on for a bit, but I’d be surprised if you guessed which team it was.
The average team had 463 important faceoffs and 304 critical faceoffs. The range of went from 358 (St. Louis) to 555 (Carolina – second place). The team with the highest number of important faceoffs had 623. Critical faceoffs ranged from 225 (also St. Louis) to 369 (also Carolina in second place) to the same team in first place with 416 critical faceoffs.
The gap between the team with the highest number of important faceoffs and the second-place team was so large that I looked for a way to confirm the team had such a high number of important faceoffs. I didn’t want to discover a calculation error after having published this article! Since important faceoffs largely take place in the third period of close games, it would seem that a team with a high number of important faceoffs should have played lots of games that were close in the third period, so their average score margin in the third period should be the lowest in the league.
For example: a faceoff in the third period while the score is 5-2 has a “score margin” of three. For the purposes of calculating the average score margin a team had in the third period (ASM3P), it doesn’t matter if the team was ahead or behind. It only matters that it was, in this case, a three-goal game (a three-goal margin).
The team in question, the Calgary Flames, had an ASM3P of 1.31. This was easily the lowest ASM3P in the league, with the other 31 teams ranging between 1.46 and 1.92. As they were mentioned previously in this section, Carolina and St. Louis had ASM3Ps of 1.52 and 1.80, respectively. All three ASM3Ps are in the area of what you’d expect for a team, given the number of important faceoffs they had.
How can the number of important faceoffs a team had to be combined with the faceoff data of a player? Ryan O’Reilly has just entered the conversation.
Opportunity Adjustments and Ryan O’Reilly
An important factor in categorizing centers is the percentage of his team’s important faceoffs that he took. Michael Backlund’s (CGY) IFOTGm is 2.16 while Aleksander Barkov’s IFOTGm is 2.15, a difference of 0.01 important faceoffs per game. But Barkov took a much higher percentage of his team’s important faceoffs (44.9%) than did Backlund (28.4%).
Ryan O’Reilly (STL, TOR) has joined the conversation because he played for two teams in 2022-23. St. Louis averaged 4.37 important faceoffs per game while Toronto had 5.35 important faceoffs per game. What value should O’Reilly be assigned for important faceoff opportunities?
I could take the average of the two team’s values (4.86), but that would be slightly inaccurate as O’Reilly played 40 games with St. Louis and only 13 with Toronto. A weighted average would produce a more accurate value. O’Reilly’s TmIFOGm (Team Important FaceOffs per Game) is 4.61, as shown below.

O’Reilly took 1.75 important faceoffs per game, so he took 38% of his teams’ important faceoffs (IFOT%: important faceoffs taken percentage).
Before writing this article, I thought each team would have one or two guys who would take the vast majority of their important faceoffs. I figured there would be one main center that would take more than 67% of the important faceoffs, and that at least twenty teams would have such a center.
Mathematically speaking, I was super wrong. Only one of the 139 centers who qualified for this evaluation took more than 50% of his team’s important faceoffs: Bo Horvat (NYI, VAN) took 54%. No player was close to 67%.
Time to Create a Statistic: CII
Sidney Crosby averaged 2.82 important faceoffs per game, 1.67 critical faceoffs per game and took 46% of his team’s important faceoffs (46.03%, more precisely). It’s time to put those numbers through a meat-grinder and come up with a unitless statistic (unitless, like the NFL’s Quarterback rating statistic QBR). The sole purpose of this statistic is to arrange the centers as to their taking of important faceoffs.
I decided to call the statistic Center Importance Index (CII). The CII formula is three times important faceoffs taken per game (IFOTGm) and two times critical faceoffs taken per game (CFOTGm), the sum of which is multiplied by the percent of important faceoffs the player has taken (IFOT%). Below is the calculation of CII for Crosby.


With a CII score of 5.41, Crosby ranks fifth in the league. The top five centers and their component data are shown below.
You won’t find Bo Horvat in the next table, which shows the top centers for each team, as it contains players who played for one team only during the season.
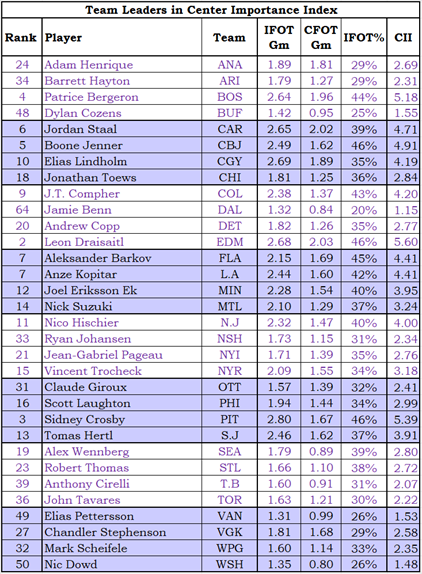
Where a team’s leading center ranked in the 40s or higher (Dylan Cozens of Buffalo is the first example), those teams regularly used three or more centers for important faceoffs.
Of course, coaches would not use multiple centers unless he had a faith in each center’s capabilities.
In the centre of the known universe (aka Toronto), Tavares and Matthews were used almost identically. Respectively, they took 1.63 and 1.65 important faceoffs per game. Tavares had the better CII because he took more critical faceoffs (1.21 per game; Matthews took 0.99).
Summary
I was truly surprised at how infrequently a team’s “main” center was used for taking important faceoffs.
That teams no longer have a main center could be the result of increases in specialization. There are centers who take the faceoffs on the left side of the rink, centers who take the faceoffs on the right side, centers who take defensive zone faceoffs, and centers who take the offensive zone faceoffs. There may well be centers who take faceoffs against right-handed opponents, or if the linesman drops the puck from his left hand.
Not mentioned anywhere in this article is the faceoff-winning percentage. That was completely on purpose: I wanted to identify the centers that were sent out to take important faceoffs, regardless of how often they won important faceoffs.
The difference in faceoff winning percentages of the top ten centers in CII (table below) shows the differences in winning percentages in all faceoffs and important faceoffs.
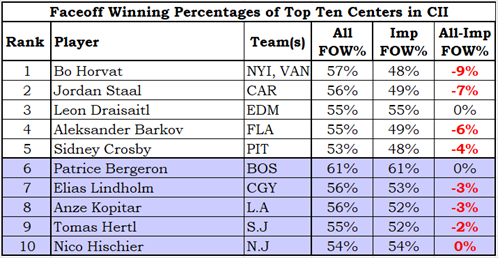
This drop in winning percentage when facing higher quality faceoff opponents cannot be a surprise. If Bo Horvat is facing off against Jordan Staal, they cannot both maintain their overall winning percentages of 57% and 56%, because that totals to 113%. The performances of Draisaitl, Bergeron and Hischier at important faceoffs are impressive and unexpected, but it could just be that they were lucky. It is well within the realms of possibility that flipping a coin 2oo times and getting heads 120 times, which is 60%.
One of my next studies will examine faceoffs and goals, looking at how long a won faceoff influences the scoring of a goal.
Related Articles
Score-Based Expected Points – The Value of a Lead