
While writing the team reviews of the 2022-23 season, it struck me that it was possible to rate goalies based on the extra goals they saved, and to rate shooters based on the extra goals they score. All I needed to do was use goals and expected goals.
In this article I will explain how Goalie Rating (GR) is calculated, look at the historic leaders and identify the top goalies in 2022-23. Side issues will be delved into.
This is a companion article to the Introduction to Shooter Rating.
Goalie Rating Calculations
GR will consist of a formula that produces a number (GR-Score), which will place a goalie in a category. Goalies will usually be described by their GR-Category rather than their GR-Score.
The formula for Goalie Rating is the simplest of any STTB rating system: it is the difference between expected goals allowed (ixGA) and actual goals allowed (iGA). This will be referred to as either GR-Score (to maintain consistency with the other rating systems) or Goals Saved (which describes it perfectly).

The GR-Category names borrow from Productivity Rating and Shooter Rating, with changes made to reflect the roles of goalies (Number1, Backup). In the table below, the percent column shows the percent of goalies in a group out of 820 goalies that were in the GR-Elite through GR-Fringe categories. 2.1% of goalie seasons (17 of 820) were in the GR-Elite category. A goalie is placed in the GR-CallUp category if he didn’t play 15 minutes per scheduled game (in 2012-13 the NHL played a 48-game season, so goalies that played under 720 minutes would be GR-CallUps.)
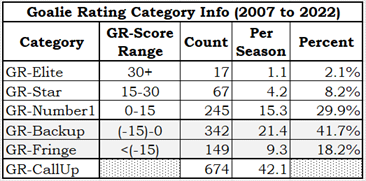
The boundaries for GR-Categories were determined so that the percent of goalies in the group reflected levels of performance: a very few goalies should be considered “elite”, a small number should be “stars”, and more should be considered “number 1” goalies.
To be crystal clear, I played with the category limits looking at the results of the table shown above, and not at where certain goalies slotted into the categories.
Goalie Rating Examples
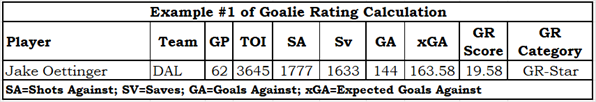
The first example shows the details of a good goalie from 2022-23: Jake Oettinger from Dallas. Based on the number and quality of shots he faced, he was expected to give up approximately 163.58 goals. He actually gave up 144 goals, giving him a GR-Score of 19.58 (163.58 – 144).
Oettinger’s play gave Dallas about nine extra standing points, based on the Pythagorean Point Prediction formula.
From the Goalie Rating Category Info table you can see there are 20.6 goalies per season who have rated GR-Number1 or better (1.1 + 4.2 + 15.3). Presently there are 32 teams in the league. Shouldn’t there be a total of close to 32 Number one goalies?
While all teams effectively have a Number 1 goalie (the goalie who plays the most), not all teams have a goalie that plays like a Number 1 goalie. The second example shows the calculations for Anaheim’s main goalie.

There is an old expression that figures don’t lie, but liars can figure. The data in the table above can be used to praise Gibson or to bury him. “Gibson played nine fewer games than Oettinger but made 150 more saves,” says a guy who is a Duck fan. “Gibson played nine fewer games than Oettinger but gave up 56 more goals,” says a guy who is a Stars fan.
Sure, Gibson gave up a ton more goals than Oettinger, but he was expected to give up a ton more: in nine fewer games his xGA is almost 30 higher. While Oettinger made more saves than expected, Gibson gave up a few more goals than expected. His 2022-23 performance placed him in the GR-Backup category, even though he was on the ice for 60% of the season.
2022-23 Goalie Rating Leaders
In 2022-23 there were a higher-than-average number of goalies who rated GR-Elite or GR-Star: four GR-Elite and eight GR-Star in total. Detailed information is in the following table.
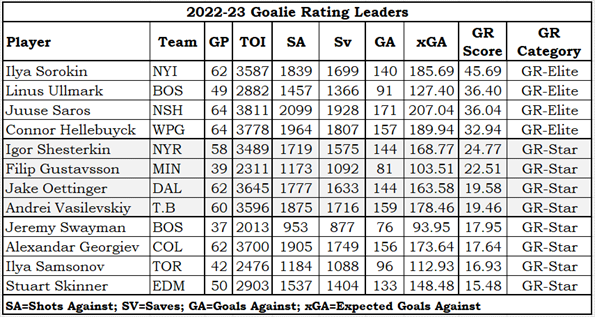
Boston has two goalies on the list, which is astounding. They reduced Boston’s goals against by about 54.35 goals: their play was “responsible” for ten wins, or twenty standing points. Boston was a great team and would easily have made the playoffs without this level of goaltending, but the goaltenders elevated the Bruins from great to record-breaking.
Are Samsonov and Skinner (the last two rows) surprises? This is where subjectivity and objectivity start to cross paths. There are goalies who have a high GR but who don’t have good press. Based on the numbers, there were only ten goalies in the league who had better seasons than Samsonov and Skinner. I can assure the gentle reader that the GR process was not targeted to benefit goalies from either Edmonton or Toronto (proof: I’m a Senator fan).
Now is as good a time as ever to look at the career leaders for Goalie rating. Are the best goalies at the top?
Career Goalie Rating Leaders
Career leaders in GR were selected based on their seasonal GR-Category data, rather than on career GR-Score. Points were assigned to the various categories (8-5-3-2-1, from GR-Elite to GR-Fringe), total career points were calculated, and then the average of that total was calculated provided the goalie had played in at least eight seasons. I didn’t want a career leader being a goalie that’s only played a season or two.
The Career Leader for Goalies is somebody you will have heard of: (King) Henrik Lundqvist. He had three GR-Elite seasons and four GR-Star seasons in the thirteen seasons he played.
The following table lists the top twelve career goalie rating leaders.
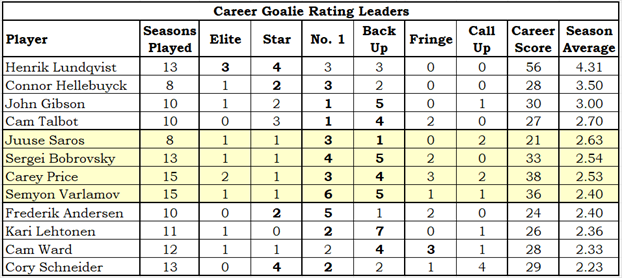
The bolded numbers on each row show a goalie’s highest pair of consecutive category finishes, and where there was a tie I used the highest possible pair. Lundqvist had three GR-Elite and four GR-Star, which is seven in those consecutive categories. He also had seven GR-Star and GR-Number1 ratings, but the GR-Elite/GR-Star combination is higher.
I was surprised at the inclusion of Lehtonen and Ward on the list: are they really among the twelve best goalies in the last fifteen years?
I think not, but some goalies who should eventually be better have yet to play eight seasons: Ilya Sorokin, Igor Shesterken, Jake Oettinger and Ilya Samsonov have all played only three or four seasons. And three of them have the initials I.S.!
Age and Goalie Rating
If you have already read the Introduction to Shooter Rating article, you may remember that Shooter Rating declines as players age, and that it declines from the first year a player plays. The only explanation that felt reasonable is that goalies “get a book” on opposing players as over time.
That thinking has an implication for how goalie ratings would progress as they age. They should start out a little lower, get better as their “book on their opponents” grows, then drop off when age starts to lower the boom on their skills.
One problem I had with the goalie data is the lack of goalie data. I had data from 607 players to get age-25 data for shooters, while the most highly populated age group for goalies is 27, where there are 81 goalies. I decided to use three years of data for each year for goalies: the age-27 data consists of all data from goalies who were aged 26 through 28, inclusive. That gave me 223 contributors to age-27 goalies.
Something that you should notice from the numbers on the graph is that most ages have a negative average GR-Score. Almost 60% of goalies are in the GR-Backup and GR-Fringe categories, which means their GR-Score is negative. The three-year-average GR-Score chart is below.
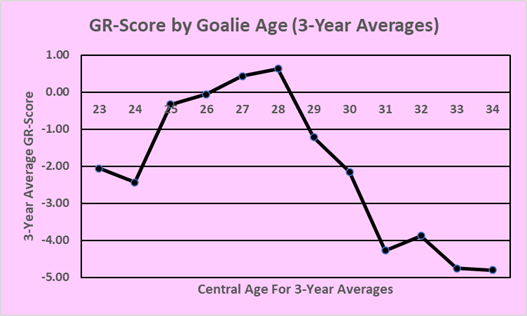
The shape of the line is pretty much exactly what was expected if goalie’s “had a book” on opposing skaters. It starts low, it improves in the early part of a goalie’s career as the goalie learns about the tendencies of his opponents, and then declines when age starts to reduce a goalie’s abilities in spite of his knowledge.
It surprises me that a goalie’s career goes into decline at age 29. While we can all think of goalies who played well in their 30s, the reality is that they are exceptions. This is called “survivorship bias,” where our focus is on the goalies that played well into their 30s (those who survived) instead of all goalies (including those who faltered and those who were no longer player).
Survivorship Bias
Survivorship bias has us looking at data from the wrong angle. We look at 31-year-old goalies and see that some are successful, so we think that 31-year-old goalies are as capable as 27-year-old goalies. A better question is “Of the goalies who played at 27, how did they do at 31?”
To examine this issue properly, we need to eliminate the call-up goalies from both the Age-27 and Age-31 groups. As noted earlier, goalies who play less than 15 minutes per scheduled game in a season are placed in the GR-CallUp category.
I counted goalies who played at age 27 no later than the 2018-19 season (which means last season would be their Age-31 season) and who played at least 15 minutes per scheduled game in their age-27 season: 61 goalies.
I counted goalies who played at age 27 no later than the 2018-19 season and played at least 15 minutes per scheduled game in their age-27 season and who played at least 15 minutes per scheduled game in their age-31 season: 39 goalies.
By looking at goalies who played at 31, we see goalies like Sergei Bobrovsky and Cam Ward and Jonathan Quick. We don’t see Steve Mason and Robin Lehner and Antti Raanta, guys who played at age 27 but were out of the league or injured at age 31.
The diagram below shows the progression of the 61 Age-27 goalies. A goalie was considered better at Age-31 if his GR-Score was higher than it was at Age-27, and was much better if he was at least 15.00 goals better. ‘Worse’ and ‘Much Worse’ work the same way. ‘Done By 31’ includes goalies who didn’t play enough to qualify in their Age-31 season, or who didn’t play an Age-31 season.
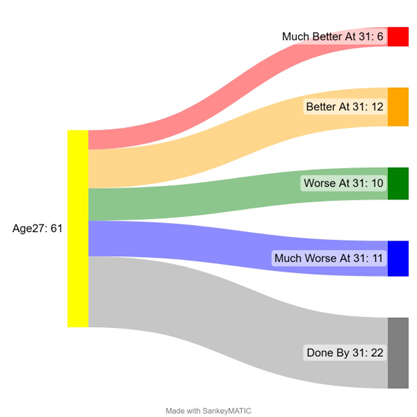
If you focus on the six goalies who played better at age 31 than at age 27, you’ll lose focus of the 43 goalies who were worse, much worse or done at age 31. That’s survivorship bias.
This raises an interesting point, in my mind at least. The GR-Score by Goalie Age chart uses data only from goalies who played at certain ages, so it contains some “survivorship bias” as well. While the Age-31 point is well below the Age-27 point, it should be lower still, as it doesn’t allow for goalies who didn’t play at 31. For the GR-Score chart specifically, I’d have to have a GR-Score for a goalie who didn’t play at Age-31.
Summary
In the summer of 2023, Stapled to the Bench introduced two new rating systems for NHL players, Shooter Rating and Goalie Rating. Shooter Rating identifies skaters who scored more than their fair share of goals, and Goalie Rating identifies goalies who prevented more than their fair share of goals.
Both rating systems were proved in a subjective manner, in that the higher ranked players are those we perceive to be the best shooters and goalies. Both articles highlighted the top players from this last season and the top players all-time. Both articles explored some side issues. Neither article had a spelling mistake.
I’m especially happy to have a goalie rating system that works. It is likely that GR will work its way into more articles in the future.
Related Articles