
While writing the team reviews of the 2022-23 season, it struck me that it was possible to rate goalies based on the extra goals they saved, and to rate shooters based on the extra goals they score. All I need to do is use goals and expected goals.
In this article I will explain how Shooter Rating (SR) is calculated, look at the historic leaders, show who the top players were in 2022-23 and then look at the players in the bottom of the list (a list with a top always has a bottom). Along the way some side issues will be addressed.
Get comfortable. This is going to be a long article.
Expected Goals: A Slight Misunderstanding
In the early days of Stapled To The Bench (STTB) I searched the internet for a definition of the expected goals statistic and didn’t find one after two full minutes of looking. I assumed that expected goals was a statistic related to shots on net. I knew it wasn’t related to Corsi, which is any shot attempt, because I saw a player who had one attempted shot and no shots on net who had an expected goal total of zero. To me, this was proof enough that a shot had to be on net to have an expected goal value.
On doing research for this article, I found a player with no shots on net but with a positive expected goal statistic. What to heck?
It turns out that expected goals are associated with unblocked shot attempts, which are counted by the Fenwick statistic. I have no idea why a shot attempt that goes wide has a positive expected goal value while a blocked shot attempt has a zero expected goal value. If an expectation is to be given to a shot attempt, it would seem to me it should be given at the moment the shot is taken, regardless the shot ends up on target or wide or blocked. Why make an exception for blocked shots?
Expected goals isn’t my statistic, so my desires for how it should be structured are unimportant. (Keep that in mind if you don’t like the structure of statistics created at STTB.) I get to use it or ignore it, and it imparts information that is way too valuable to ignore.
Shooter Rating: SR-Score and SR-Category
Shooter Rating (SR) will identify players who scored “more than their fair share” of goals.
As with all rating systems at STTB, SR will consist of a formula that produces a number, and that number will place a player into a category. When using SR at the player level in future articles, players will be described by their SR-Category.
The formula for Shooter Rating is the simplest of any STTB rating system: it is the difference between goals scored by a player (iG) and the goals he was expected to score (ixG). This will be referred to as either SR-Score (to maintain consistency with the other rating systems) or Goals Gained (which describes it perfectly).

A player with a negative SR-Score has scored fewer goals than expected, while a player with a positive SR-Score has scored more goals than expected. SR-Score is converted to an SR-Category using the rules shown in the following table.
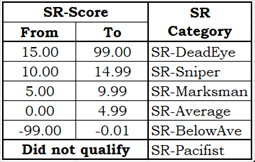
The “did not qualify” category called SR-Pacifist is for players who didn’t take many shots in the season. (They don’t shoot much so they are pacifists: it’s a small joke.) If there were no SR-Pacifist category, the SR-Average and SR-BelowAve categories would have many more players in them.
Should Powerplay Data Be Used in SR Calculations?
SR is calculated based on statistics generated in all manpower situations, from powerplay to even strength to penalty kill.
I thought about the use of powerplay data for quite a while. Players score way more frequently on the powerplay than at even strength, and good scorers get more powerplay opportunities than those who light the lamp infrequently. Would using powerplay data just bump up the numbers for the high scorers? I went back and forth in my mind for many hours mulling this over.
I should have just checked the data, as that settled the matter in a few seconds. While powerplay specialists score more goals, they also have more expected goals. At the league level over three seasons, there was virtually no difference between powerplay scoring and all-situation scoring with respect to the ratio between goals scored and expected goals scored (G/xG in the following table).
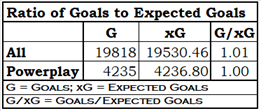
Powerplays had higher rates of scoring and expected scoring per 60 minutes, but the ratio was similar to that of all situations. As powerplay time-on-ice did not provide players with a shooting advantage, Shooter Rating uses powerplay data.
Why Low-Shooting Players Should be in the SR-Pacifist Category
The next table shows two players with their 2022-23 data, Timo Meier and Alex Belzile. They had similar SR-Scores but Belzile was put in the SR-Pacifist category.
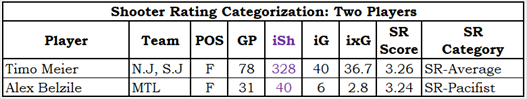
The “iSh” column is the shots a player has taken, and it is the datum used to determine whether a player qualifies for Shooter Rating evaluation. A player must have taken at least one shot per scheduled game in order to qualify. Belzile took more than one shot per game he played, but there were 82 games scheduled in 2022-23 and he is well short of 82 shots.
Belzile is an excellent example of the dangers of categorizing players using their per-game-played statistics instead of their season statistics. If you multiply Belzile’s shots by eight you get 320, which is about as many shots as Meier had. The following table shows the results of multiplying all of his data by eight.
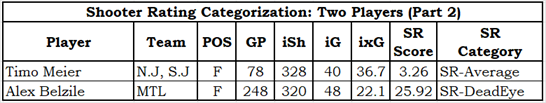
Apparently, Belzile was the deadliest shooter in the league in 2022-23. In fact, he was one of the deadliest shooters of all time (check out the SR-Scores of season leaders since 2007-08 that is a couple of sections below). All Montreal has to do now is figure out how to get him to play 248 games in a season.
This is the danger of using per-game statistics. It would make one give a high rating to a player who played less than half a season and who only got 11 minutes per game when he did play. It would make Montreal management look like idiots because they limited the playing time of the best shot in the league. It would make the statistician who said “this guy is the best shot in the league” look like an idiot.
Goals are scored by skill and by chance. I’m guessing Belzile was the beneficiary of a couple of lucky breaks, increasing his goal total from four to six. Those two lucky breaks just happened to increase his goal total by 50%.
Shooter Rating: Historic Distribution of Players
Below you will see the counts of players by SR-Category. The percent column is the percent of players in all categories except SR-Pacifist: 6,558 players in total.
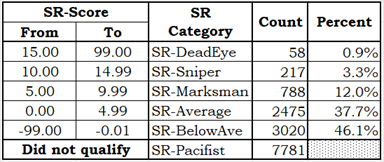
The distribution of players in the top three categories (1%, 3%, 12%) is very appropriate. Any player in a category above SR-Average had a good season shooting, but they weren’t all equal to each other. Or, to borrow a phrase from Animal Farm, some good shooters are more equal than others.
Let’s take stock of where we are. Conceptually, SR is hard to argue with: a player who scores more goals than he is expected to, based on the number and quality of shots he takes, must be a good shooter. Players are distributed through the SR-Categories appropriately, and the category names are nice. But does the objective data (SR-Scores, SR-Categories) agree with our subjective perceptions (that certain players are considered good shooters)?
Shooter Rating Since 2007-08: the Usual Suspects
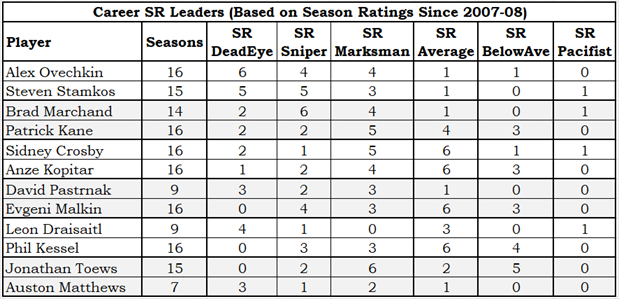
The top twelve players in terms of Goals Gained (which is the same as SR-Score) since 2007-08 are listed below. On line three, you’ll see that Brad Marchand (BOS) has scored 372 goals, which is 122.6 goals more than he was expected to score.
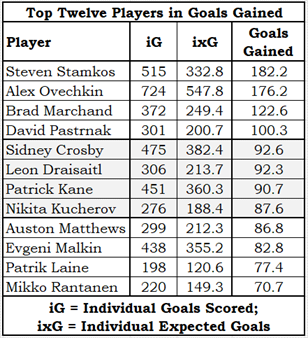
I think it is very clear that the objective data matches our subjective perceptions. While the table may not include a player or two you think should be there, you cannot really argue with the players who are included. They have all been excellent shooters and have scored well more than their fair share of goals.
Let’s take a look at the top twelve players in terms of expected goals scored. The four players in bold font are in the Top Twelve Goals Gained table.
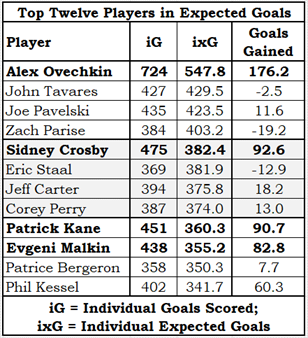
Seven of this group of twelve players have scored about what they were expected to score: they are within 20 goals of their expectation over their careers (since 2007-08). Those seven players are neither SR-DeadEyes nor SR-Snipers, but they are absolutely great goal scorers who have scored their fair share of goals.
The next table shows how the players in the two tables above were categorized in Shooter Rating over the years. Keep in mind that four of the players (Ovechkin, Crosby, Kane, Malkin) appear in both tables, so their counts contribute to both columns.
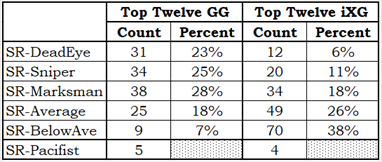
The group of good shooters (Top Twelve Goals Gained) were rated SR-Marksman or better in 76% of their seasons, while the other group (Top Twelve in Expected Goals) did that in only 35% of their seasons.
SR Season Leaders Since 2007-08
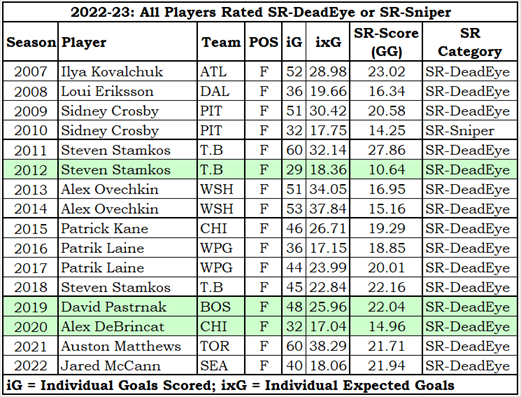
The lines shaded in green were shortened seasons (lockout, pandemic, pandemic). Allowances were made in the SR calculations for those seasons, which is why Stamkos is listed as an SR-DeadEye in 2012-13 despite his SR-Score of 10.64 (SR-Sniper, normally).
This is even more proof that the SR process works: the right guys lead the league in shooter rating every year, with possibly two exceptions (Eriksson, McCann).
2022-23 Shooter Rating Leaders
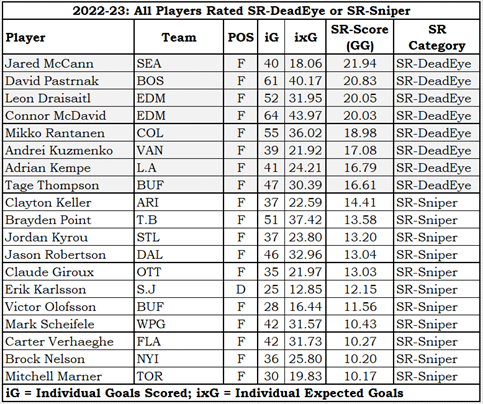
The table above shows all the players who rated SR-DeadEye or SR-Marksman in 2022-23.
McCann came out of nowhere to lead the league in Shooter Rating. His previous seasons have seen him rated as SR-Marksman (3 times), SR-Average (1 time) and SR-BelowAve (1 time). Adrian Kempe also had a huge increase this season, while Andrei Kuzmenko started his career as an SR-DeadEye.
Not rated in one of the two highest categories in 2022-23 was Mr. Auston Matthews. After three straight SR-DeadEye seasons, Matthews slipped to SR-Average in 2022-23, as he dropped to 40 goals while his expected goals total went up a touch (from 38.29 to 39.04). Had he scored one fewer goal, the unfeeling SR formulas would have resulted in him being SR-BelowAve.
“He dropped to 40 goals” is such a strange phrase, when you think about it.
2022-23 Shooter Rating Trailers
I usually don’t talk about the bottom end of scales, as I do not want to be seen as insulting or belittling players. But this is a new rating system we need to investigate the data of the lower performers in SR.
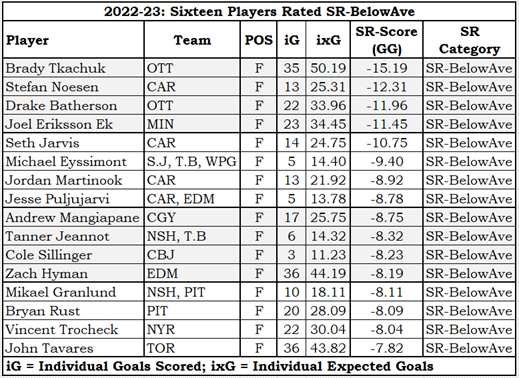
If you watched Ottawa Senator games this season there were a couple of dozen times you would have asked, “How on earth did the Sens not score there?” The lack of shooting effectiveness from Tkachuk and Batherson cost Ottawa somewhere around 27 goals and nine standing points: Ottawa could have had 95 points rather than 86. Florida made the playoffs with 92 points, so this lack of productivity might have cost Ottawa a playoff spot.
Here’s one more table where players at this end of the rankings dominate.
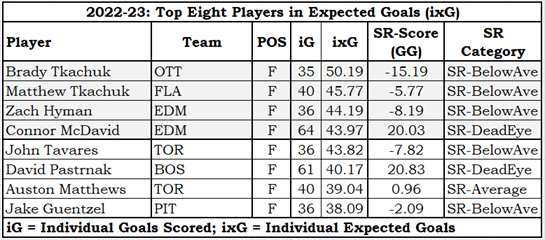
The Tkachuk brothers were one-two in individual expected goals, and neither of them scored as much as they should have. Why?
My resident hockey expert (my son) tells me that Brady’s style leads to him getting a lot of shots that are over-valued in terms of expected goals. If there is one player in the league who plays like Brady it is his brother Matthew, who also scored below expectation.
I hate to disagree with my son as he has an annoying habit of being right about things like this, but in this instance I will disagree. If there was a type of shot that expected goals was over-valuing, then the difference between the totals of expected goals and actual goals would be larger than they are. At the league level, the totals are 8,247 actual goals and 8,262.1 expected goals. Because those two totals are so close, to say that the Tkachuk-type shots are overvalued, you also have to say that some other type of shot is undervalued, and that those two incorrections balance out.
The Tkachuk brothers are relatively early in their career. They’ll probably get more effective in shooting as they age, right?
Age And Shooter Rating
The data clearly shows that the older you get, the less effective your shooting becomes. This decline starts from the first season a player plays.
I can show this age-related decline using a slightly different metric: goals gained per 82 games played (GG/82). Take total goals gained (GG) and total games played (GP) of all players in an age group, divide GG into GP and then multiply the result by 82. GG/82 allows for the comparison of all age groups on an equal footing, without having to worry that 27-year-old players played many more games than 21-year-old players.
The chart below shows GG/82 by age of player. There were at least 125 players in each season-age (from 20 to 35) who qualified for SR evaluation.
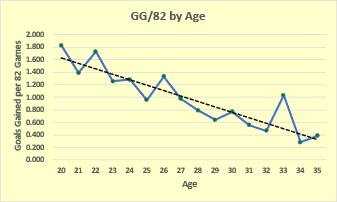
The solid blue line shows the average goals gained per 82 games, while the dashed black line shows the trendline of the data. Both lines get lower as they extend to the right, showing that shooting effectiveness decreases over time. The age-33 point is known as “the exception that proves the rule.” It may be a good omen for Nazem Kadri (CGY), who will be 33 next season.
The reason all ages show a positive in goals gained is that the players who contributed data were restricted to those who qualified for SR evaluation. Those players have a positive GG/82 about 54% of the time. Players who do not qualify for SR evaluation have a positive GG/82 30% of the time.
It was very surprising to me that the trend for shooting goes down as players age from the very start of their careers, as it means that players are most deadly at shooting at the earliest parts of their careers. I expected to see both an up-slope and a down-slope: I thought players would improve their shooting touch in their first couple of seasons, as they increase their general skill level and have access to NHL-level coaching and training.
Why is a 23-year-old player (picking a young age at random) a less effective shooter than he was as a 20-year-old? Age absolutely impacts a player’s overall skill level as Father Time eventually reduces their capabilities, but surely this shouldn’t be happening at such a young age. I can’t imagine a sport where you are old and declining at 23 (ignoring performance athletics like gymnastics, which isn’t really a sport).
I wonder if this data is less about the shooters and more about the goalies. If a goalie knows a player likes to shoot from a certain spot on the ice, it increases the likelihood that he’ll make a save. As time goes on, goalies will learn more and more about the tendencies of the players they face, thus lowering the effectiveness of those players.
In a 2004 article written for the Boston Globe by Kevin Paul Dupont, he noted that some goalies used to “tote around spiral-bound notepads, jotting down the tendencies of opposition shooters.” But in 2004, he thought that there were too many players for a goalie to keep track of (348 opposition forwards), and that they no longer took notes.
The times have changed with the introduction of computers and statisticians. Every shot is tracked, the shooter is known, where the shot came from is known, and the shot’s target is known. Team statisticians can comb through this data to find the tendencies of opposition shooters and pass that information on to team goalies on the day of the game. Goalies don’t need a book on every single opposition shooter: they can focus on the dangerous players. A goalie playing against Ottawa would want to know about Tim Stutzle’s shooting tendencies, and wouldn’t worry much about Austin Watson’s tendencies.
I don’t know for a fact that teams use data this way, but it’s 2023 and they should be doing it. A team that isn’t using data this way is being managed by cavemen.
Is Shooter Rating Consistent at the Player Level?
This is an important question to ask. If the annual results of SR for players bounce around like the numbered balls in a lottery drum, SR is trivial at best.
To determine whether SR is consistent, I looked at SR-Score rather than SR-Category, as it has two advantages. Using SR-Score allows for an age-adjustment in the following season, and it makes it possible to recognize a player as having been similar to his previous season even though he may have changed categories.
Age Adjustment
As noted just above, Goals Gained drops from year to year; noted at the start of the article is that goals gained is the same thing as SR-Score. On average, a player’s SR-Score drops 0.25 from one season to another (where he qualified for SR categorization in both seasons).
Crossing Categories
A player can have a small change in his SR-Score but due to the unfeeling rules of categorization could end up in a different SR-Category. Elias Pettersson is a good example. His SR-Score in 2021-22 was 10.05, making him SR-Sniper. In 2022-23, his SR-Score dropped to 9.16, making him SR-Marksman. If I was looking at categories, this would count as a drop in performance, but if I look at SR-Score, it is essentially the same performance.
Is SR Consistent?
I’m going to define consistency as a player whose current SR-Score is within 5.00 of his previous season’s SR-Score, provided that he qualified for SR categorization in both seasons.
But we know that SR-Score drops 0.25 from one season to another, and it is appropriate to include that information in the consistency formula. A player will be considered consistent if his current season SR-Score is no more than 4.75 points above the previous season’s SR-Score, and no more than 5.25 points below the previous season’s SR-Score.
Since 2007-08, players qualified for SR categorization in successive seasons 4,827 times. 3,213 times the player’s SR-Score in the subsequent season was within the +4.75/-5.25 of the previous season. That is almost exactly two in three times (66.56%).
SR is consistent enough for government work, as we like to say at STTB.
Summary
Most of the time that I’ve created a rating system I had a good guess at what the results would be, at least in terms of who would be near the top. The first calculations I did were for the 2022-23 season, and three of the top eight players (McCann, Kuzmenko and Kempe) were surprises to me.
Immediately I asked myself if this was a valid statistic. If the results for every season were surprising, if the rating scores bounced around as if they were determined by a roll of the dice, SR would be meaningless and I would move on to something else.
To make that determination, I needed data from more seasons, so I got data from all seasons and ran the numbers. I was pleased to see that the results seem to be meaningful, in that the usual suspects usually rise to the top and that the number of dice involved in determining SR-Scores was relatively small.
There is no objective proof that SR is meaningful. The scores generated by the statistics are mathematically correct, but that doesn’t make them meaningful. After all, I could divide ‘second assists’ by ‘hits taken’ and the resulting number would be mathematically correct.
SR’s proof of utility is subjective in nature. There is an expectation that certain players should appear at the top of the list. Below is one more table that provides subjective proof of the correctness of SR.
The biggest surprise from SR is that players tend to have their best SRs at the start of their careers. I expected that SR would be a little low at the start of a player’s career, rise as he approached his peak age (which is around 27), and then descend more rapidly than it rose as the player approached the end of his career. That the data shows a straight downward trend as players age is completely unexpected.
Finally, I learned that not all players who score lots of goals have outstanding shooting statistics. Players like Pavelski and Tavares have scored as many goals as expected, based on their shot quantity and quality. These players score goals, lots of goals, in a different way.
Related Articles
Introduction to Goalie Rating