
Sometimes a good player has a poor season. Sidney Crosby’s 2010, 2011, 2012 and 2019 seasons were all significantly impacted by injuries, and his Productivity Rating for those seasons reflect the missing games.
The two charts below show how much Crosby has played (GP and MPG chart on the left) and his PR (the other chart) since the 2007/2008 season. The dips in the blue columns on the GP and MPG chart are mirrored by dips in the “PR” chart.
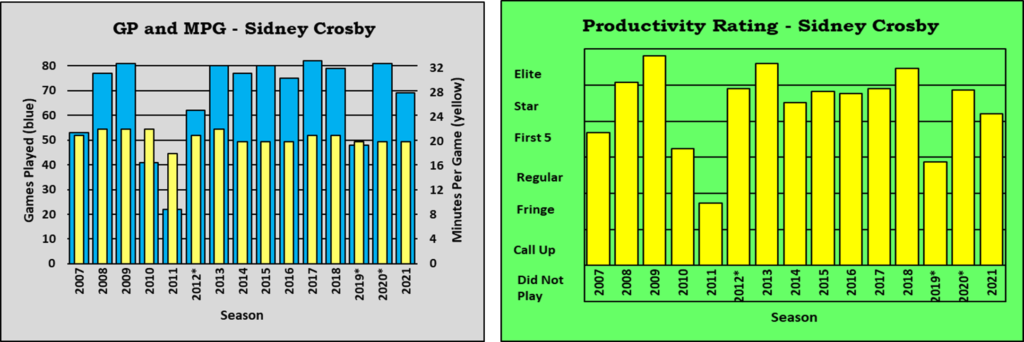
In the GP and MPG chart, the thick blue columns show games played (and uses the scale on the left) while the thin yellow columns show minutes played per game (scale on the right). For example, in the 2015 season Crosby played 80 games and 20 minutes per game. Games played data from the lockout and pandemic shortened seasons are presented on an 82-game scale so that the column heights are consistently meaningful. Crosby played 36 of 48 scheduled games in 2012/2013, which is the equivalent of 62 in an 82-game schedule; the chart shows 62 games played.
To be clear, the PR results for Crosby are very accurate representations of his seasons. But they are not an accurate representation of Crosby’s value. This is where Value Rating comes in.
These Two Guys You Know
There are two players I’m using as examples to explain Value Rating. Both are defensemen, both have played every season since 2007. One has missed a couple dozen games in those fifteen seasons; the other has missed a couple hundred. Their names are Ryan Suter and Kris Letang.
First, here’s a look at their Career GP and MPG charts.
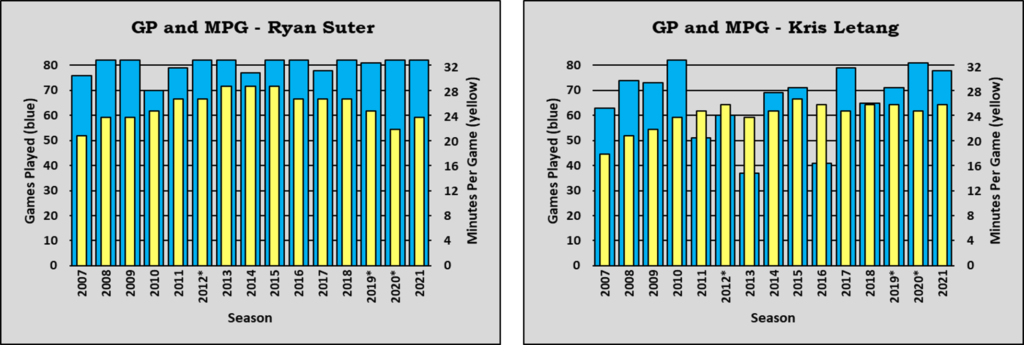
Suter has played at least 90% of the scheduled games each season, while Letang has done that in about half of his seasons. Both players took several seasons to hit their peak in playing time, but Suter’s time-on-ice has been decreasing while Letang’s has remained constant.
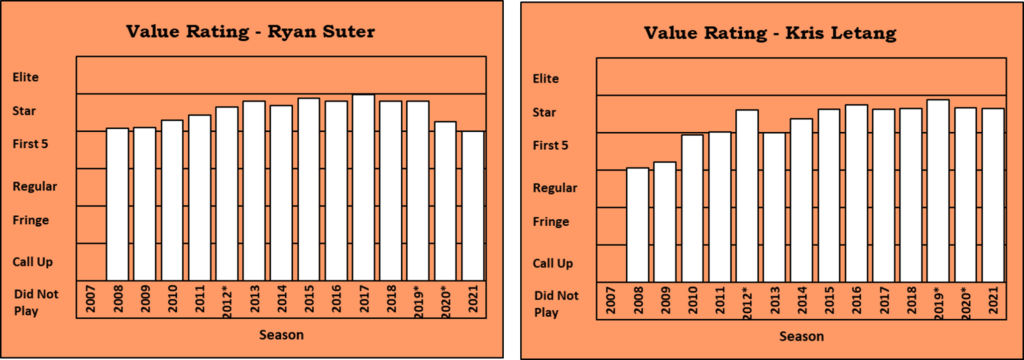
Now let’s look at their Career PR charts.
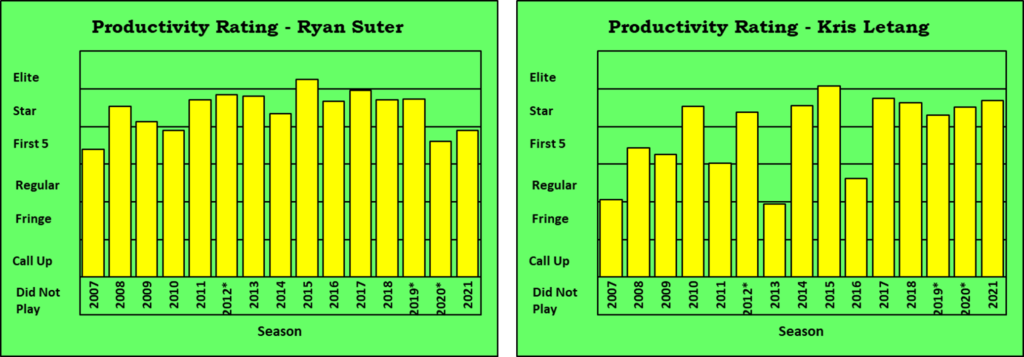
Suter’s career PR is a model of consistency. Eleven seasons of PR-Star or better ratings. Letang’s PR has not been consistent, and his lower PR seasons coincide with seasons he missed games (as they would do for any player). In his healthier seasons his PR is in the same range as Suter, but even in his healthier seasons he still missed games. Letang has played 90% of the games in a season four times, while Suter has done so fourteen times.
Most people, I believe, would think that Letang has always been the more valuable player. Let’s see what Value Rating says.
Calculating VR
The rules for calculating a player’s Value Rating (VR) for a given season are simple.
Rule #1: VR must have the same scale as PR. It must also use the same category names.
Rule #2: in order for a player to have a value in a season, he must have played a game in that season. Jonathan Toews does not have a VR for the 2020/2021 season.
Rule #3: A player must have played at least 50% of the scheduled games in the last three seasons to qualify for a VR. Thinking of three 82-game seasons, a player must have played 122 games to qualify. This means that a player can qualify for a VR in two seasons, where he could play as many as 164 games. For the lockout and pandemic shortened seasons, I make appropriate adjustments.
Rule #4: There is absolutely NO rule #4.
Rule #5: The data from the three seasons will be weighted 5, 4 and 3, with the most recent season weighted highest. The most recent accomplishments should count for more than those from two seasons ago.
Rule #6: VR-Score will first be calculated as if the player played 82 games, and then will be adjusted if he has missed games in the last three seasons. It’ll be an adjustment that is more than favourable to the player; there will be more information as this step is explained below.
The rest is just math. The table below shows the VR calculation numbers for both Ryan Suter and Kris Letang. The first two seasons were pandemic-affected, and the games-played values shown in the example have been adjusted to an 82-game level.
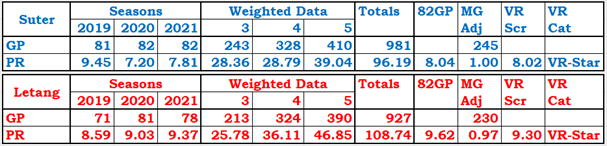
The PR figures shown above are rounded to two decimal places.
The weighted data multiplies a season’s count by the season’s weight: Letang played 71 games three seasons ago, which is multiplied by 3 to get 213. The same thing happens to the PR-Scores.
The Totals column shows the total weighted games played (981 for Suter) and total weighted PR-Score (108.74 for Letang).
82GP shows the PR-Score that the player would have in 82 games played. For Suter, the calculation is (82 * 96.19) / 981, which is 8.04.
MG Adj is the missed game adjustment. The adjustment factor is the square root of (games played divided by games scheduled). Letang played (230/246) 93.5% of the scheduled games in the last three season (0.935), so his adjustment is 97% (0.970).
The official VR-Score is the 82GP_VR multiplied by the games played adjustment factor. For Letang, 9.62 times 0.97 is 9.30 (9.3005 in its full glory).
At the end of the 2020/2021 season, both players are in the VR-Star category, which covers VR-Scores from 8.0000 to 9.9999.
Career Value Rating Chart
One of the nice things about VR is that it is more stable than PR.
Kris Letang’s missed more than half the games in the 2013 season and was below his standards when he did play. That seasons affected his VR in 2014 and 2015 as well.
VR shows that Ryan Suter had slightly more value than Kris Letang from 2008 through 2018, when Letang started out-ranking him as Suter’s PR started dropping. Without the missed-games adjustment, Letang would have been ahead of Suter since the 2012 season.
I have decided that the missing-games-adjusted-VR is a better measure of a player’s value, as it recognizes that a player tends to miss games. It seems silly to give an 82-game rating to a player who has averaged 66 games played in three seasons. A player who has missed 48 games in three seasons is very unlikely to play a full schedule the next season.
Another way of looking at VR is that it is next season’s expected PR. Sidney Crosby’s VR from 2021/2022 is VR-Star: if he stays reasonably healthy next season, we’d expect him to be a PR-Star. He’s missed the equivalent of 16 games a season over the last three seasons, so what does reasonably healthy mean? The VR formula says reasonably healthy means, for Sidney Crosby, that he’ll play 73 games (not 66, not 82).
Summary
The two main player rating systems used by Stapled To The Bench are Productivity Rating (PR) and Value Rating (VR). PR will be used when a player’s output is put to the question, while VR will be used when his value is of interest.