
I was reading a post on the r/hockey subreddit that asked whether people thought hockey was a Strong Link sport or a Weak Link sport.
A Strong Link sport is a sport where the team with the better stars is most likely to win, with the NBA being the most obvious example. A Weak Link sport is one where the team with the better weaker players is likely the best. The example given was soccer (or football, depending on your heritage), where a team with a few weaknesses is quite unlikely to win.
In hockey which type of team is more likely to win: teams with the better skill players or teams with the better depth players? I have run the numbers from regular season play from 2007-08 through 2022-23 and have arrived at a conclusion. Before I answer the question, it behooves me to tell you how the analysis was done, what numbers were used, and how they were run.
Answering the Question: The Big Picture
I have data from more than 14,000 player seasons over sixteen seasons. I also have the regular season records of all 488 teams in those seasons (for this analysis, the 2007-08 Detroit Red Wings were a different team than the 2008-2009 Red Wings).
For each team, I will determine which players were its skill players and which were its depth players. I’ll quantify the groups of skill and depth players, identify the top 25% of teams in those areas, and see how they did in the regular season.
If hockey is a Strong Link game, the high Skill teams will do better than the high Depth teams. If it is a Weak Link game, then the high Depth teams will do better than the high Skill teams.
Skill Players, Depth Players, Miscellaneous Players
Determining whether a player was a Skill player or a Depth player was easy enough, but in many cases it produced results that are contrary to our perception of players. Let me step you through my thought process.
Firstly, players had to be placed into a group based on statistics, not on opinions. While I like to think that I am the Ottawa Valley’s main distributor of opinions, I do not have an opinion on each player from each season. What I do have is the Productivity Rating of each player in each season.
Secondly, players will be placed in a group for a season based solely on how they played in that season. Ryan O’Reilly was a different player in 2010-11 (COL) than he was in 2018-19 (STL) than he was in 2022-23 (STL, TOR).
For each team for each season, the top six forwards and top three defensemen were placed in the Skill Group, and the next six forwards and the next three defensemen were placed in the Depth Group. All other players were placed in the Miscellaneous Group and were subsequently ignored.
O’Reilly was in the Skill Group 2010-11 Colorado and 2018-19 St. Louis. In 2022-23 he was in the Depth Group in St. Louis and the Miscellaneous Group in Toronto (because he only played thirteen regular season games for the Leafs).
Numbers That Were Used: Productivity Rating Score (PR-Score)
PR-Score is the number part of Productivity Rating: it indicates “precisely” how productive a player was in a specific season. A PR-Score of 10.00 or more means a player was PR-Elite, one of the top twenty or so players in the league: in 2022-23 Mitchell Marner (TOR) had a PR-Score of 10.38. Most skaters who play a non-trivial number of games have PR-Scores between 4.00 and 7.99 (PR-Regular, PR-First5).
For players who were traded during a season, their PR-Score was divided between the teams they played for, based on how many games they played for each team. Bo Horvat played for Vancouver and the New York Islanders in 2022-23. For the season he was in the PR-Star category and had a PR-Score of 9.48. His team-level PR-Scores were 5.88 for Vancouver and 3.60 for the Islanders.
It has to be noted that these arbitrary groupings of players will not accurately reflect the lines and pairs that teams actually used during a season. One reason for that is lines and pairs change constantly during a season. A second reason is injuries. Good players who missed a significant number of games will have lower than expected PR-Scores and could end up in the Depth Group or even the Miscellaneous Group. A third reason is trades, where the proportional distribution of a player’s score could move him down in the groups, as did the aforementioned Bo Horvat. He was in the Skill Group for Vancouver but was in the Depth Group for the Islanders.
Horvat’s placement for the Islanders is an accurate reflection of that portion of his season that he spent with the Islanders. If he had started the season with the Islanders and missed games because of an injury, he’d get the same rating.
Numbers That Were Used: Standing Points and Playoff Potential
Team success will be measured by regular season standing points, adjusted to 82 games in shortened seasons. For example, the 2012-13 Philadelphia Flyers finished the 48-game schedule with 49 points, which was equivalent to 84 points in an 82-game season. They are considered an 84-point team.
Categorizing Teams Based on Their Skill and Depth Groups
Every team had a Skill Group and a Depth Group, but those groups were obviously not even. Consider two teams from 2014-15: the Boston Bruins (96 points in the regular season) and the Buffalo Sabres (54 points). The following table shows each team’s Skill Group, showing player names and their PR-Categories.
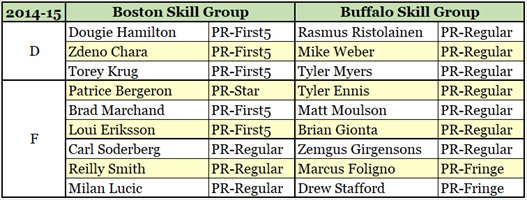
The players in the Buffalo Skill Group were at least one category below their counterparts in Boston’s Skill Group, except for Girgensons and Soderberg. Soderberg was the better of the two, just so you know.
To do the Strong-Link-Weak-Link analysis I needed to put a number on each team’s Skill and Depth Groups. Having used PR-Score to place players in each group, the obvious number to use was the sum of the PR-Scores. Boston’s Skill Group Score (SG-Score) in 2014-15 was 58.25; Buffalo’s SG-Score was 44.01. I did the same calculations for the Depth Groups (DG-Score): Boston’s DG-Score was 32.39 while Buffalo’s DG-Score was 30.24.
Teams were placed into four categories for Skill Groups (S_1 through S_4) and Depth Groups (D_1 through D_4) based on their Group Scores. As there were 488 teams in the study, the boundaries for the groups were established so that there were between 121 and 123 teams in each group. Boston’s 2014-15 team is in S_3 and D_3, while Buffalo was in S_4 and D_4. A third set of groups (T_1 through T_4) were established based on the total PR-Score of a team’s top eighteen players, which would be the sum of SG-Score and DG-Score, which is called TG-Score.
Obviously, my approach to answering the Strong-Weak question can only work if the teams with the better players according to their PR-Scores won more frequently than teams that have players with lower PR-Scores, as that would show that higher PR-Scores are related to winning.
The following box-and-whisker chart (an explanation is given under the chart) shows this approach should work. It displays season point data for teams grouped by team-level data based on TG-Scores.
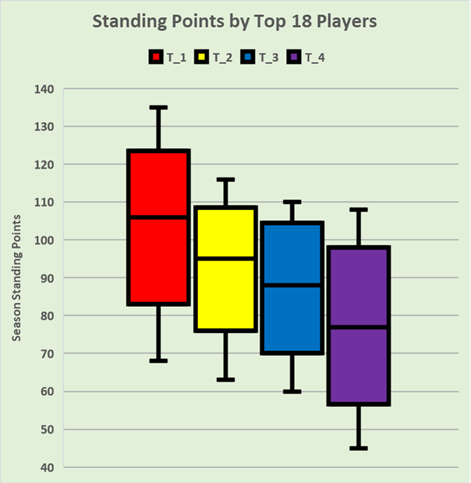
Box-and-whisker charts show the distribution of observations within a population: in this case, the observations are standing points and the population groups of teams. The central part of the observations (the boxes) are bounded by the 25th and 75th percentile values. The line inside the box is the 50th percentile value. The whiskers show the normal range of observations. Some populations have outlier observations which would be shown by dots above and/or below the whiskers.
The red box shows Group T_1, which is the top 25% of teams based on the total PR-Score of their top 18 players. The maximum points for a T_1 team were 135 (Boston, 2022-23), half of the T_1 teams had been 98 and 112 points, the average was 106 points, and the minimum points was 68 (Tampa Bay, 2012-13, 40 points in a 48-game season).
Teams with players with higher PR-Scores had more regular season success, and the lower a team’s top-18 PR-Scores were, the less success they had.
Now, let’s see if hockey is a Strong Link or a Weak Link sport.
Answering The Question: Strong Link or Weak Link?
In the following table, you will see the data for T_1, S_1, and D_1. Each group contains the top 25% of teams in the various categories (Top-18 Group, Skill Group, and Depth Group). A special combination is shown in the fourth data row.
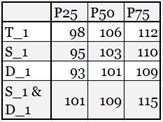
Teams with the better Skill Groups have been ever so slightly more successful than teams with the better Depth Groups, getting one or two more points on average. Neither of those groups has been as successful as teams that have the better top-18 players (T_1 in the first data row).
The fourth data row shows teams that were in S_1 and D_1: they had better results than the teams with the better Top-18 talent (T_1).
Wait, what? Aren’t the teams with the highest total from their top eighteen skaters also teams that have the top Skill Groups and the top Depth Groups? Not always! A team could have a very good Skill Group (S_1) and a slightly weaker Depth Group (D_2 or D_3) but still be in T_1 because of their Skill Group.
The fourth row of this table shows that hockey is more of a team sport than a Strong Link or Weak Link sport.
Problems With How the Question Was Answered
Glaringly obvious is that the play of goalies was not included. Great goalie play can elevate a team and weak goalie play can sink a team. They were not included because goalies cannot be measured using PR.
The analysis uses only the top eighteen skaters of a team. This is a smaller problem than not using goalies: nobody has ever suggested a team wins because it has a great 20th-best skater.
Problems With How the Question Was Asked
The problem with the question is that it is a “politician’s question”. The question implies there are only two options, Strong Link or Weak Link. It is an example of the “either-or” fallacy.
When done by a politician, it is usually a manipulative method that tries to force people to accept the speaker’s viewpoint as legitimate or ethical. “Do you want reduced housing prices, or do you want the annual number of immigrants to continue as is?” The implication in such a statement is that immigrants are 100% responsible for the rise in housing prices, which is clearly a ludicrous position to take.
Having just slagged politicians, let me be clear that I am 100% convinced that the reddit poster did not mean the question to be a politician’s question. It was a nice, short question that asked whether you thought the answer was A or B and sought to get responses within that framework. He didn’t want people saying the reason teams won came down to the arena’s organist.
But, still, if the question is read literally, you’ve got yourself an “either-or” fallacy.
Summary
Is hockey a Strong Link sport or a Weak Link sport? Based on the analysis of teams from the last sixteen seasons, my answer is: no.
Hockey is a team sport. While teams can be successful by relying on either good skill players or good depth players, better results come to teams with a good set of top-18 players, and the best results come from teams with both good Skill and good Depth players.
One of the big problems with posts on Reddit is that they have the shelf life of a glass of milk. This was an interesting question, but almost every single answer to it was entered in the first couple of hours. Each answer seemed to be based on a couple of minutes of thought and even less effort: how hard is it to spell words correctly?
It took me about three weeks to consider the question, determine the data I had to answer it with, devise a method that used the data, perform the analysis, find a chart that showed information usefully, and write the whole thing up. By the time I determined an answer, Reddit had long forgotten the question.
Also, Reddit posts that go past ten lines are subject to people whining about their length. I’m sure a rambling six-page post would be most unwelcome.
Reddit is good in that some posts start me thinking. It is bad in that posts have to be replied to immediately if you want your reply read by anyone. There is little to no time for thoughtful consideration of a question, so the replies tend to be opinions.
Related Articles