In 2022-23, Vegas had a better road record than home record and won the Stanley Cup. Last season, Florida had a better road record than home record and won the Stanley Cup.

These two events are the sort of thing that hockey colour commentators dream about. They could say, “You have to have a better road record than home record to win the Stanley Cup,” and prove their insight using the last two seasons.
But is a team’s road record really the stuff that Stanley Cup dreams are made of? I need a little more proof than what happened in the last two seasons.
What Makes a Team a King of the Road (KOTR)?
There are two possible ways to look at what makes a team a good road team. They could have winning road records, or they could have better records on the road than at home. Both Vegas and Florida would qualify under either of those definitions.
If the focus is teams with winning road records, a lot of very good teams that have traditional home/road splits will be included, as the two teams below.

I’m going to focus on teams that have better road records than home records, based on the statement my fictional colour commentator would make. That does mean that some pretty poor teams are going to be considered Kings of the Road, as shown below.

Let’s start asking some questions about the Road Kings.
How Many Kings of the Road Have There Been?

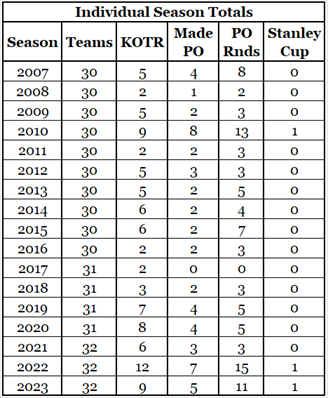
The Individual Season Totals table shows the number of teams that played in a season, the number that were Kings of the Road (KOTR), the number of those teams that made the playoffs (Made PO), the Playoff rounds that those teams played (PO Rnds) and the number of Stanley Cups those teams won.
Since 2007-08, a total of 94 teams have been Kings of the Road: 53 of them made the playoffs, and only three of them won Stanley Cups. This alone tells us that being Kings of the Road has little to do with winning the Stanley Cup. If it was meaningful, it would happen more frequently than three times in seventeen seasons.
Aside from 2010-11, there were a maximum of six Kings of the Road in any season between 2007-08 and 2018-19. Since 2019-20, there have never been fewer than six Kings of the Road.

The next table shows grouped season counts.
The average number of Road Kings per season has gone from 4.6 to 8.5. This brought up a question I hadn’t considered before starting the article. Is the recent increase in Road Kings meaningful?
Is There Any Significance in the Recent Increase of Kings of the Road?
Probably not.
I am only using data from seventeen seasons. This is a small-n (small sample size) situation. Variations within a small sample may look to be more meaningful than they actually are, especially if they are clustered.
One way to determine if the increase is significant is to look at the standard deviation data for King of the Road counts for the earlier seasons and the recent seasons. If there was no overlap at the two-standard-deviation ranges, that would indicate there is significance in the increase.
What is a standard deviation? It quantifies the amount of variation or dispersion in a set of values. A low standard deviation means the data values are close to the average value, while a high standard deviation means the data values are more spread out. The standard deviation of the weight of ten normal cats will be low, while the standard deviation of the weight of ten normal horses will be larger (simply because the values are bigger), and the standard deviation of the weight of five cats and five horses would be enormous.
Standard deviation can be used to determine if two sets of values are significantly different. If the two-standard deviation range of the data sets do not overlap, then it is likely that the data sets are significantly different.
Let’s say the cats have an average weight of 10 pounds with a standard deviation of 2.5 pounds, making their two-standard-deviation range 5 pounds to 15 pounds. And let’s say the horses have an average weight of 1,100 pounds with a standard deviation of 300 pounds, making their two-standard-deviation range 500 pounds to 1,700 pounds. The ranges don’t overlap; this proves that the weight of cats and horses are significantly different.
Returning to the Kings of the Road, the following table shows the standard deviation spreads for both sets of seasons. To explain the column headers, -2 SD means two standard deviations below average, and +1 SD means one standard deviation above average. I’m confident you can infer the other meanings.

The highlighted cells show that there is a small amount of overlap for the two sets of data at one standard deviation (6.34, 6.43). There is a lot of overlap at two standard deviations.
While this doesn’t prove that there is no significance in the increase, it shows it is possible that the increase is simply a normal variation in teams being Kings of the Road.
Are There Teams That Are Constantly Kings of the Road?
What if I asked a related question? Do teams try to have a better road record than their home record?
I cannot believe any team would try to have a better road record than their home record. Teams want to win every game they play, regardless of its location. If a team had a strategy that would produce more victories for them, they would use it at home and on the road.
Another problem with team-level consistency across seasons is that teams change: old players retire, young players join the team, and trading and free-agency change adds and subtracts players. How can a team continuously excel in a subset of their games (road games) when their “cast and crew” changes each season? The only way that could happen is if the players didn’t matter.
That being said, the three teams that have most frequently been Road Kings since 2007-08 are the New York Rangers (seven times), the Boston Bruins (six) and the Montreal Canadiens (five). At the other end of the spectrum, Tampa Bay has never been a Road King, while Chicago, Carolina, Minnesota and Winnipeg have each been Road Kings only one time.
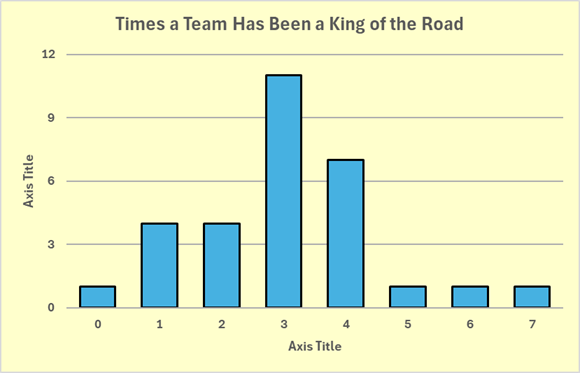
Below is a chart that shows the number of times that the 30 teams who have played all seasons since 2007-08 have been Road Kings. Vegas (1 of 7 seasons) and Seattle (2 of 3) are not included.

Overall, the distribution looks random to me: a lot of observations in the middle, not many at the edges. For only 30 observations, the shape is remarkably close to a bell curve.
What Makes a Team Road Kings?
Is there anything in the data that shows how teams become Kings of the Road? Is there a difference between Kings of the Road (KOTR) and Home Bodies (HB)? HB are teams that have a better home record than road record.
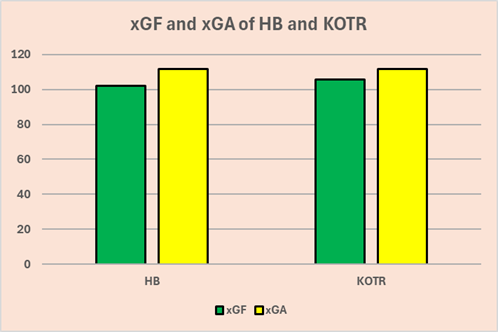
The following chart shows expected goals for (xGF) and expected goals (xGA) against data for HBs and KOTRs. The scale for both xGF and xGA is shown on the left of the chart, running from 0 to 120.

What you should notice, aside from this chart’s hideous background colour, is that there is no appreciable difference between Home Bodies and Kings of the Road.
The next chart shows where the difference between these sets of teams actually is.

The The difference between Home Bodies and Road Kings is in goals for and goals against. Road Kings didn’t play better than Home Bodies, they just got better results from their play.
The total difference between HBs and KOTRs is about nine goals per season. That advantage could be attributed to a couple of good shooting forwards and a reasonable goalie, or it could be puck luck.
Without spending a week researching this aspect, I assume the advantage comes from puck luck. If you think nine goals is too big to be a result of luck, I’ll point out that it is nine goals over 41 games. That works out to one lucky bounce every four games.
The calculations for this section extrapolated season-level data to 41 games, where necessary (lockout and pandemic seasons). This put the shorter seasons on the same scale as “normal” seasons.
Summary
For a change, I will use the summary section to actually summarize its article. Let me review what I learned from team-level data from the last seventeen seasons.
There is no indication that Road Kings are more likely to do well in the playoffs. Three of 94 Road King teams won the Stanley Cup. With 32 teams playing in a season, a total of 96 teams would play over three seasons, and three of those teams would win the Stanley Cup.
There is no indication that teams are consistently Road Kings. They are some seasons; they aren’t other seasons. The distribution of the counts of Kings of the Road by team resembles what would happen if being a Road King was a random event.
It would appear that Road King teams are Road Kings because of puck luck.
To get a better idea about that, it would be necessary to look at the players. Team results come from the play of their players, so if teams are actually (as opposed to randomly) Road Kings, they would have players that are Road Kings, and those players would be the same ones from season to season.
Hmmm. I wonder what my next article will be.
Related Articles
