
A “lines and pairs” article will show the strengths and weaknesses of teams by comparing the Productivity Rating (PR) of their forward lines and defensive pairs to the league average. Some teams are strong up front, some teams have good third and fourth lines, and Chicago falls into neither of those categories.
The data in these charts were collected at approximately the mid-point of the 2022-23 season.
How Lines and Pairs are Identified
No forward line or defensive pair play together for the entire season, what with injuries and losing streaks. Players have been assigned to lines and pairs based on their statistics. As an example, the top three forwards for every team in terms of PR were declared their first line (F1), and the next three best forwards were declared their second line (F2).
Pairs and lines had their average PR calculated at the team level and at the league level. Team charts show how each team’s lines and pairs compare to the league average.
Metropolitan Division – Line and Pair Total PR
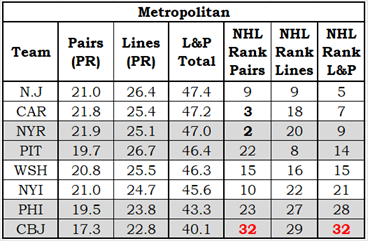
The Division Table shows each team’s total for Pairs, Lines and team (L&P Total). It also shows where the teams ranked in each category in the league. For example, the Pittsburgh Penguins ranked 22nd in defensive pairs, 8th in forward lines and 14th overall.
In the rank columns, a team in the top three in the league will be in bold black font, while a team in the bottom three will be in bold red font.
Line and Pair Charts
I will use the New Jersey Devils to explain an L&P chart.
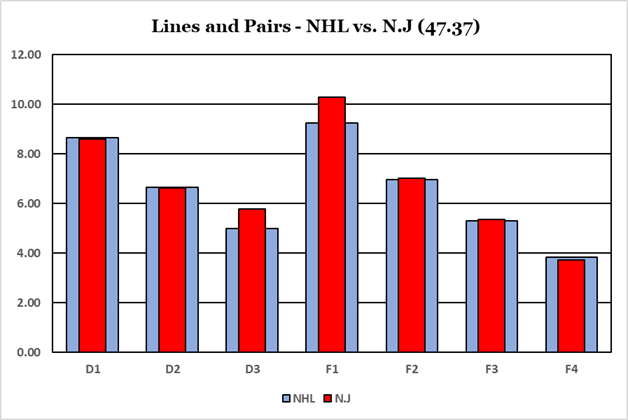
The league average ratings are the wide blue columns, while a team’s ratings are shown in narrow red columns. Defense pairs are shown first and forward lines follow. The chart title shows the team’s total line and pair rating: 47.37 for New Jersey (5th in the league).
The Devils are not super strong anywhere, but they have no weak areas. They are led by 3-H club: Dougie Hamilton, Jack Hughes and Nico Hischier.
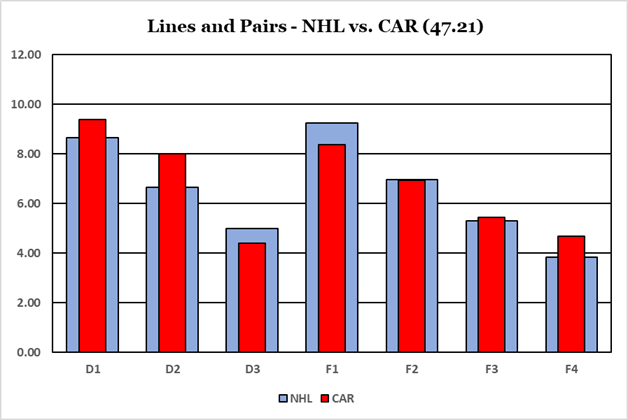
Carolina has strength at defense but have no depth, weakness at F1 but good depth (F3 and F4).
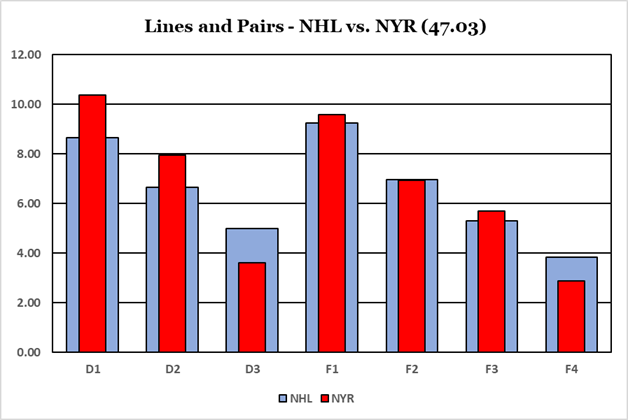
The Rangers have good high-end talent but the depth of an inflatable swimming pool. D1 and D2 are both very strong, D3 is “dismal.” F1 through F3 are a little above average, F4 is “dismal.” When an aspect of your team is being described, you do not want the adjective “dismal” used.
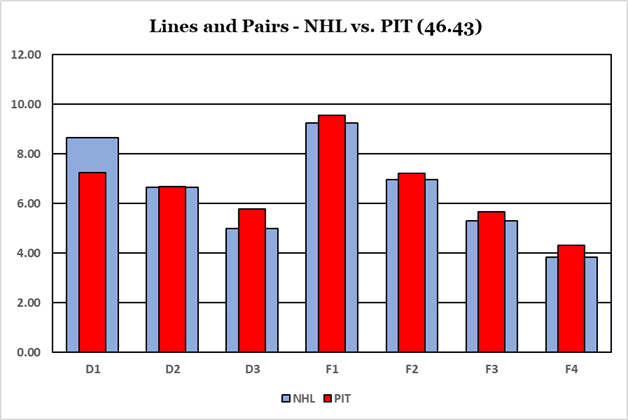
Pittsburgh has some defensive issues: D1 is well below average. All four lines are better than average.
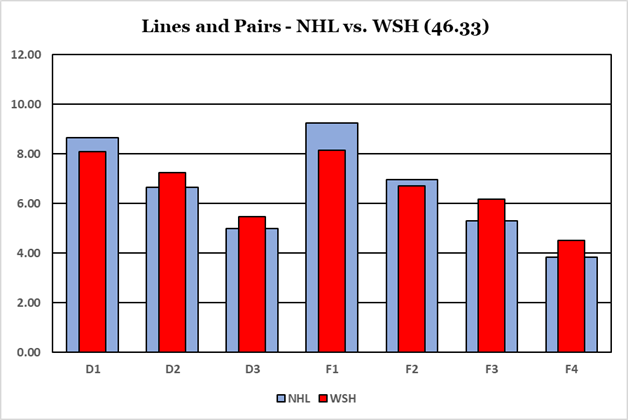
Washington is almost the opposite structure of the Rangers. The Capitals have solid D2, D3, F3 and F4; their D1, F1 and F2 are below average. Ovechkin’s mid-season rank for PR is 52nd in the league and the Capitals have no other players in the top 100.
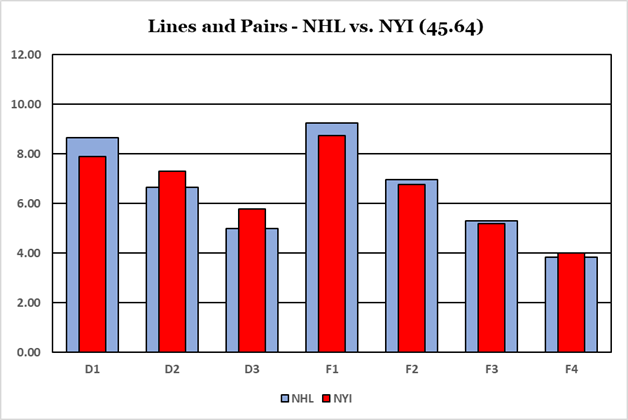
In terms of Lines and Pairs, the Islanders are fascinatingly similar to the Capitals. I only noticed this because the Islanders chart follows the Capitals chart. The biggest difference between the two teams is that Washington has a better third line.
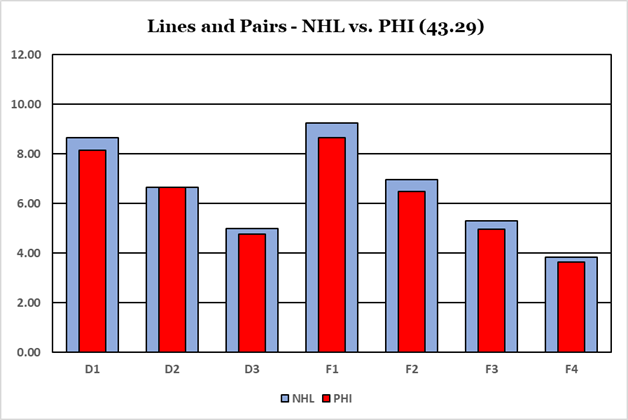
Below average in every pair and on every line, technically. They are very close to average at D2; their score is 6.64 while the league average is 6.66. When you are 99.7% of average you are technically below average.
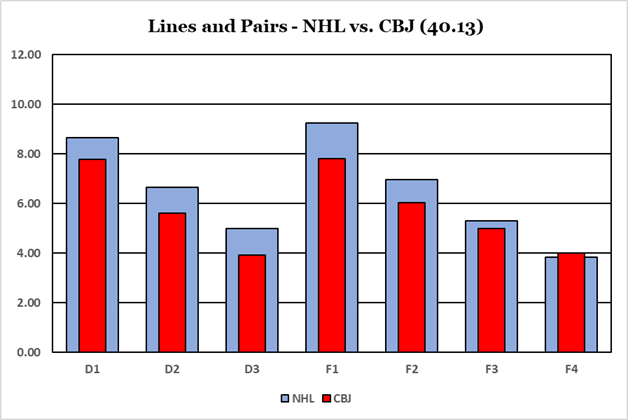
The Blue Jackets are way below average on all defensive pairs, and way below average at F1 and F2. They have been hit hard by injuries, but so has Colorado, and the Avalanche are not last in the league for L&P.
Summary
The Metropolitan Division has the best group of defensemen, thanks to Carolina and the New York Rangers. They lack stellar quality at forward (considering all 96 forwards across the eight teams). A typical Metropolitan Division game might end 2-1 in a shoot-out.