
A “lines and pairs” article will show the strengths and weaknesses of teams by comparing the Productivity Rating (PR) of their forward lines and defensive pairs to the league average. Some teams are strong up front, some teams have good third and fourth lines, and Chicago falls into neither of those categories.
The data in these charts were collected at approximately the mid-point of the 2022-23 season.
How Lines and Pairs are Identified
No forward line or defensive pair play together for the entire season, what with injuries and losing streaks. Players have been assigned to lines and pairs based on their statistics. As an example, the top three forwards for every team in terms of PR were declared their first line (F1), and the next three best forwards were declared their second line (F2).
Pairs and lines had their average PR calculated at the team level and at the league level. Team charts show how each team’s lines and pairs compare to the league average.
Atlantic Division – Line and Pair Total PR
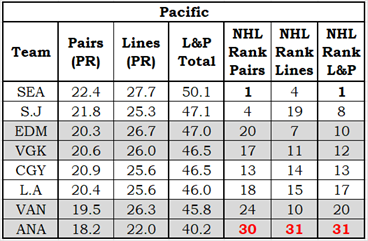
The Division Table shows each team’s total for Pairs, Lines and team (L&P Total). It also shows where the teams ranked in each category in the league. For example, the Calgary Flames ranked 13th in defensive pairs, 14th in forward lines and 13th overall.
In the rank columns, a team in the top three in the league will be in bold black font, while a team in the bottom three will be in bold red font.
Line and Pair Charts
I will use the Seattle Kraken to explain the chart.
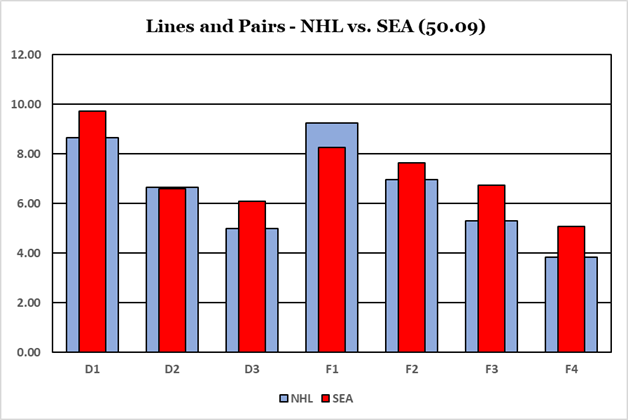
The league average ratings are the wide blue columns, while a team’s ratings are shown in narrow red columns. Defense pairs are shown first and forward lines follow. The chart title shows the team’s total line and pair rating: 50.09 for Seattle (1st in the league).
Seattle has good defense and great depth at forward, with their only deficiency being a below average F1.
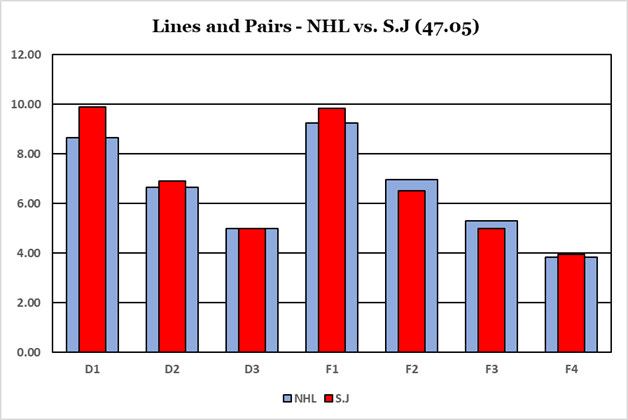
Comparing the Sharks to the Kraken produces interesting results. Defensive pairs are somewhat similar, with the Sharks being better (thanks to EK65). The Shark forwards are the opposite of the Kraken, with a good F1 but with below average F2 and F3 and a below Seattle F4.
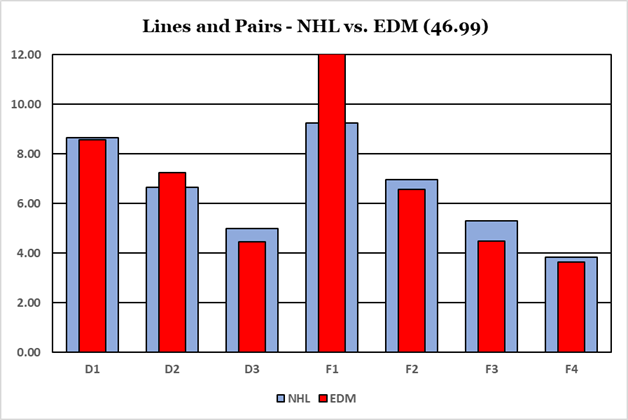
The picture says it all. Edmonton is a one-line team with a little assistance from the defence. They are below average at D3, F2, F3 and F4.
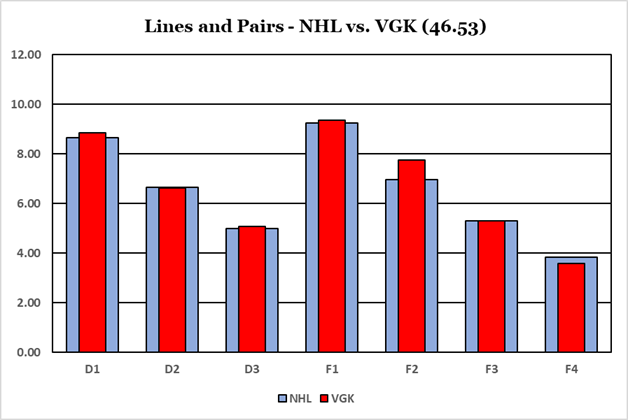
The Knights of Vegas are very close to average in all defensive pairs and forward lines except for F2, which is well above average.
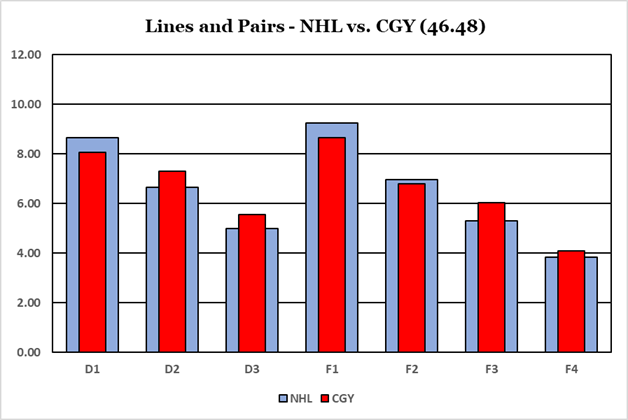
Calgary is one of those teams that lacks up-front talent but has good depth. They are below average at F1 and D1, average at F2, and above average everywhere else.
Strength in the middle of the lineup, mediocrity in the back end, below average at the top. Not exactly the typical configuration of a Stanley Cup contender.
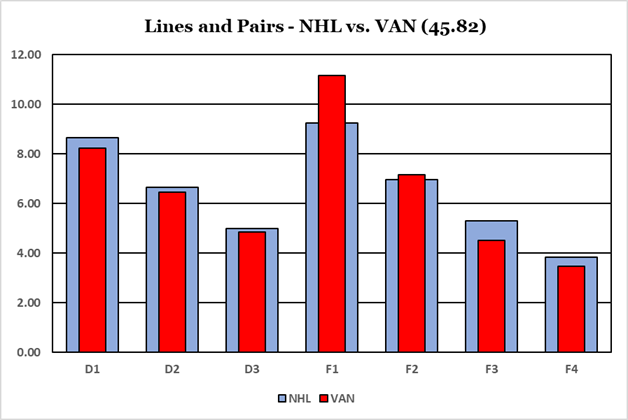
It is both fascinating and difficult to watch what is going on in Vancouver. Even with Quinn Hughes, all defensive pairs are below average. Thanks to Horvat and Pettersson, the Canucks are stellar at F1 (2nd in the league).
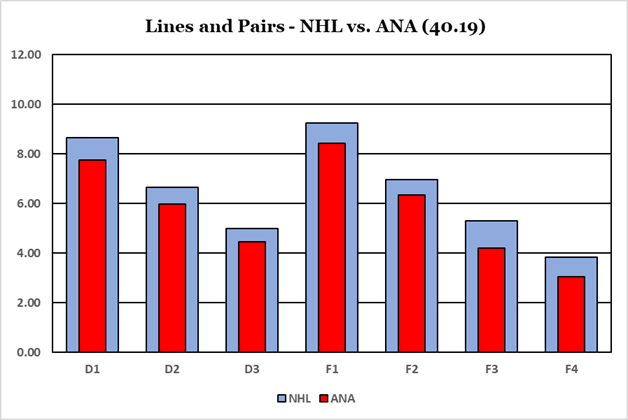
Below average across the board and second-last in team L&P. The only Duck rated in the top 100 in the league is Troy Terry, not Trevor Zergas: the Productivity Rating formula is about the stats, not about the flash.
Summary
The L&P ratings don’t perfectly match the standings: San Jose has a good L&P rating but is second last in their division.