
A “lines and pairs” article will show the strengths and weaknesses of teams by comparing the Productivity Rating (PR) of their forward lines and defensive pairs to the league average. Some teams are strong up front, some teams have good third and fourth lines, and Chicago falls into neither of those categories.
The data in these charts were collected at approximately the mid-point of the 2022-23 season.
How Lines and Pairs are Identified
No forward line or defensive pair play together for the entire season, what with injuries and losing streaks. Players have been assigned to lines and pairs based on their statistics. As an example, the top three forwards for every team in terms of PR were declared their first line (F1), and the next three best forwards were declared their second line (F2).
Pairs and lines had their average PR calculated at the team level and at the league level. Team charts show how each team’s lines and pairs compare to the league average.
Central Division – Line and Pair Total PR
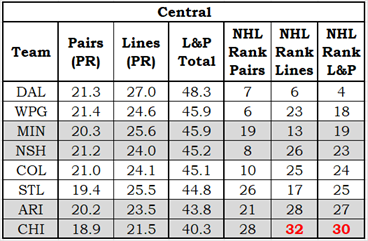
The Division Table shows each team’s total for Pairs, Lines and team (L&P Total). It also shows where the teams ranked in each category in the league. For example, the Nashville Predators ranked 8th in defensive pairs, 26th in forward lines and 23rd overall.
In the rank columns, a team in the top three in the league will be in bold black font, while a team in the bottom three will be in bold red font.
Line and Pair Charts
I will use the Dallas Stars to explain an L&P chart.
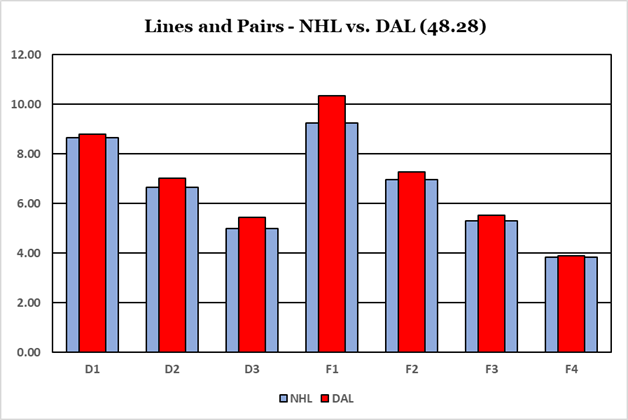
The league average ratings are the wide blue columns, while a team’s ratings are shown in narrow red columns. Defense pairs are shown first and forward lines follow. The chart title shows the team’s total line and pair rating: 48.28 for Dallas (4th in the league).
Dallas is above average on all lines and on all pairs. F1 is the strongest part of the team, and F1 and D1 are obviously the places you want to be strongest.
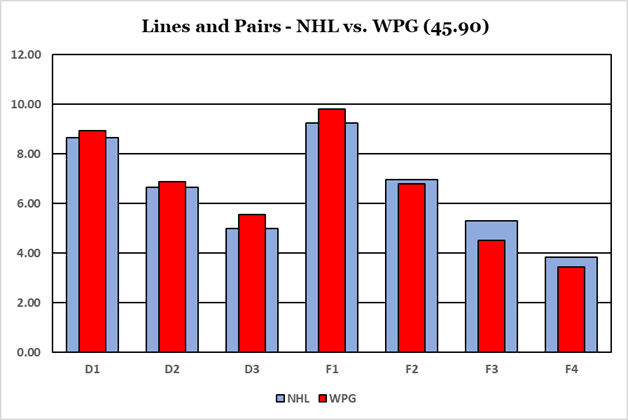
Winnipeg is getting along with an above average defense and a good first line.
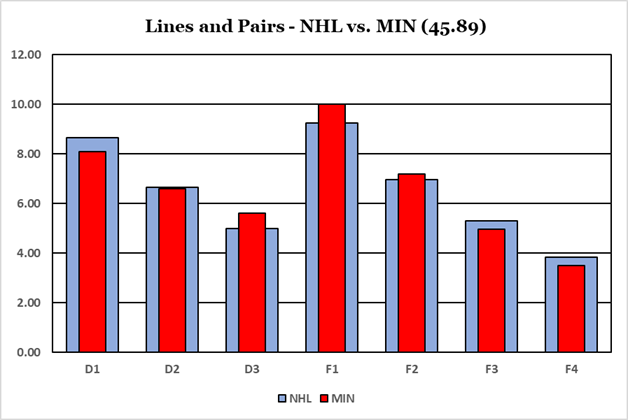
Strong at F1, F2 and D3; weak at F3, F4 and D1. Minnesota is one of those teams where one part (forwards for them) goes from above average to below average while the other part (defense) goes from below average to above average.
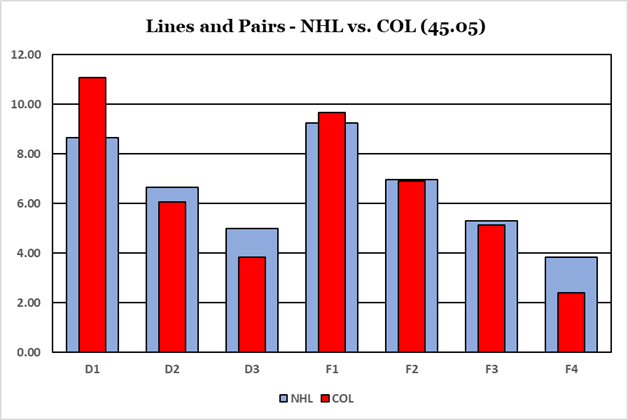
D1 shows the Cale Makar effect. He is an elite player, and he is usually paired with a very good partner (Devon Toews) whose numbers improve because he is with Makar. Because Nathan MacKinnon has missed a dozen games or more, the forwards are actually led by Mikko Rantanen. Possible playoff issue: weak D3, weak F4.
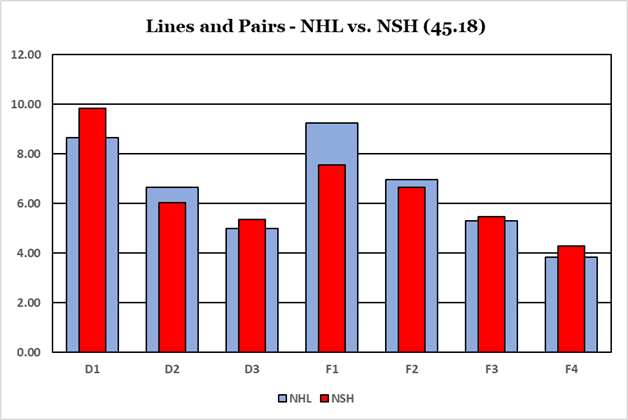
While it must have happened for other teams and I just didn’t notice it, Nashville has above average D1 and D3, but a below average D2. The forwards start off below average but end up above average. If you can only have one line above average, it should be F1.
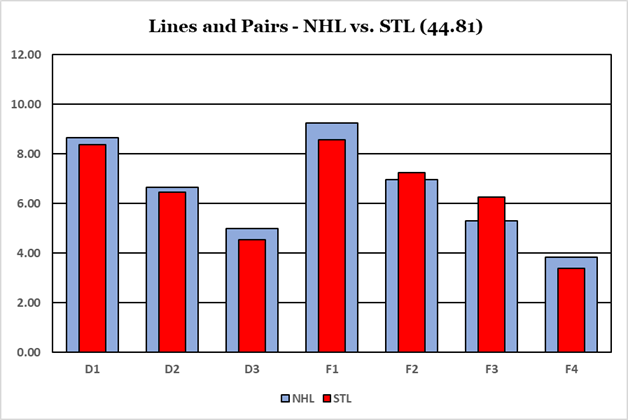
The third line of the Blues is second in the league. St. Louis has only two players ranked in the top 100: Robert Thomas (F) is 65th while Justin Faulk (D) is 76th. Ryan O’Reilly is having an off year and is ranked 159th. Vladimir Tarasenko is 269th and Torey Krug is 299th.
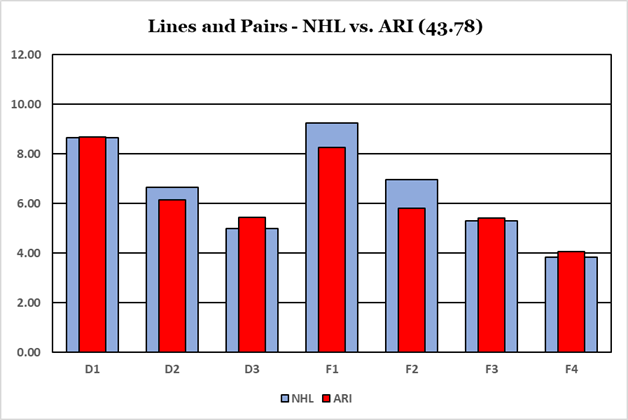
The Coyotes have the worst F2 in the league. Is it a good sign that they are slightly above average at F3, F4 and D3? Because it takes less time, Arizona announces the paid attendees instead of the starting lineups at the beginning of home games.
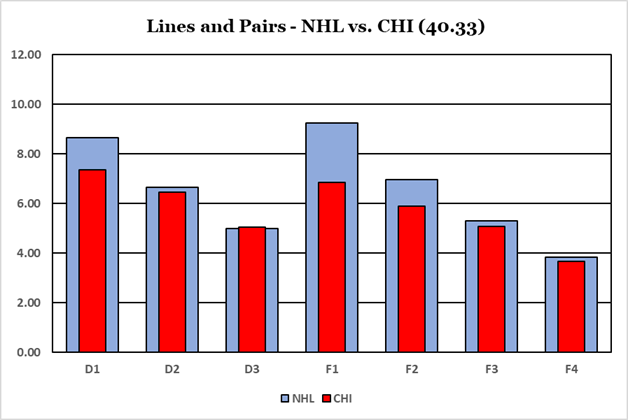
Chicago: 30th as a team; 32nd for forwards; 32nd for F1; 31st for F2; 29th for D1. Is it fortunate for Chicago that they are this bad considering the supposed strength of this year’s draft class? Was it the plan?
Summary
As a division, the Central has the lowest ranked group of forwards. Five Central teams are in the bottom ten in the league and only one team is in the top ten.