
Once again, a Reddit post caught my attention. I should go out and touch grass instead of surfing the internet, but it’s not easy to touch grass under a foot of snow.
The post was in the r/habs subreddit, and its title read “I’ve Always Hated The Narrative That Suzuki Isn’t a Number One Center. This Guy Never Misses a Game and Has Always Continued to Get Better Every Single Year Since He’s Been in the NHL.”
An image of a post from Twitter (X, whatever) said, “Suzuki is the tenth-highest-scoring [sic] center in the NHL. I am officially putting the ‘Suzuki isn’t a legitimate first-line center’ narrative to bed. For good.”
Caffeine can be a wonderful stimulant, I guess. Suzuki is clearly a good player and a center. The discussion as to whether he is a #1 center interests me.
Career PR and VR Charts of Nick Suzuki
When I said that Nick Suzuki was a good player, that was not fan talk, it was fact talk. Below are his Career Productivity Rating (PR) and Value Rating (VR) charts.
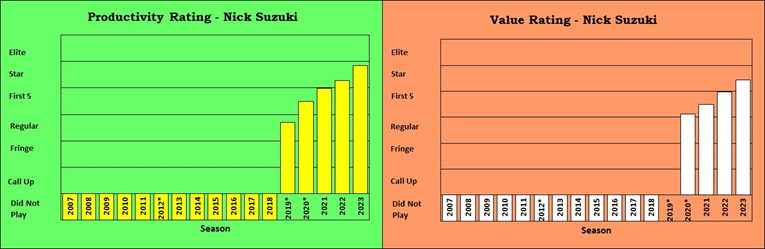
Suzuki has gotten better each season (so far), and he has missed zero games in his first five seasons. He had the 27th highest PR-Score in the league in 2023-24. What we have in Nick Suzuki is an excellent player who plays center. Does that make him a #1 center?
Commenters Comments
One commenter sagely noted: “No, Suzuki isn’t an elite #1C, but he’s absolutely a #1C. There are [sic] 32 teams in the NHL and there aren’t [sic] 32 better centers [sic] than him. That’s as simple as that.”
Another commenter said: “Between him and Matthews I take [sic] Suzuki anytime for a Stanley Cup run.” This statement is how you tell people you are a Montreal Canadiens fan without specifically telling them you are a Montreal Canadiens fan.
The first comment made me reflect on how centers could be categorized, while the second comment made for a fun section in this article.
What is a #1 Center?
Stapled to the Bench (STTB) holds these truths to be self-evident: a #1 center takes and wins a lot of faceoffs; is good offensively; gets a lot of ice-time; plays in all situations; is responsible with the puck. All of these aspects of being a good center can be measured using NHL statistics that are part of the set of statistics used to calculate Productivity Rating (PR).
Fortunately, STTB has a Center Rating system (CR) that does nothing but rate centers. When that system was reviewed as part of writing this article, CR was found to be inadequate. A new Center Rating system had to be developed.
Why a New Center Rating System?
The previous Center Rating system did not adequately value what must be the prime factor in being a center: the taking of faceoffs.
According to CR, in 2022-23 there were 33 centers who merited the top rating. Six of those players won fewer than five faceoffs per game they played. A player who wins four faceoffs a game cannot possibly be a #1 center. He may well be an excellent forward, but he’s barely a center. CR over-valued scoring: #1 centers accrued 46% of their CR-Score from scoring and only 11% of their CR-Score from taking faceoffs.
The new Center Rating system, inventively named CR2, was developed using data from 2023-24, the most recent full season. CR2 values faceoffs much more heavily than CR: 2023-24 #1 centers got 39% of their CR2-Score from faceoffs, only 20 % from scoring. The lowest number of faceoffs taken per game was 11.4 and the lowest number of faceoffs won was 5.8 (Connor McDavid, EDM).
Center Rating Two (CR2) System: CR2-Score, CR2-TM, CR2-LG
As with almost every rating system STTB has, CR2 will consist of a numeric score (CR2-Score) and a category. CR2 actually has two categories: team-level (CR2-TM) and league-level (CR2-LG). A player can be the #1 center on his team but a #2 center in the league. He can also be a #2 center on his team but a #1 center in the league.
In order to evaluate all players fairly, per-game statistics are used. A center who missed a number of games should not be put in a lower category because of those missed games.
When using per-game statistics a minimum time-on-ice rule is required to remove the two-game wonders from being categorized as the best in the league. Only players who have played at least 10 minutes per scheduled game will qualify for evaluation. In a non-pandemic-impacted season, players have to play a minimum of 820 minutes to qualify.
Center Rating Two (CR2) System: CR2-Score
The two most important categories for CR2 are faceoffs won per game and faceoffs taken per game. The next most important is points per game. Other categories used are time-on-ice, PR-Score, team-relative Corsi, defensive zone starts and “puck control”, which is a combination of takeaways, giveaways and blocked shots.
All of the categories generate scores, which are added together to produce the CR2-Score for a player. For example, John Tavares (TOR) had a CR2-Score of 202.
Center Rating Two (CR2) System: CR2-TM, CR2-LG
Largely in reaction to the first-quoted comment, centers are rated within their teams as well as within the league. For players who played for multiple teams their team rating will be their rank within the players who played for multiple teams (the MUL team).
At the league level, largely due to the first commenter’s comment, the top 32 ranked centers will be considered #1 centers. The next 32 ranked centers will be #2 centers, and so on. Within each group of 32 centers, the top eight will be A centers, the bottom eight will be C centers, and the players in the middle will be B centers.
Center Rating Two (CR2) System: Establishing Credibility
The only way to establish the credibility of CR2, or any rating system, is subjective. Do the objectively determined top-ranked players agree with our subjective notions of who they should be? If there are surprising inclusions or exclusions, do the data support the objective results? Let’s look at the top eight centers from 2023-24, according to CR2.
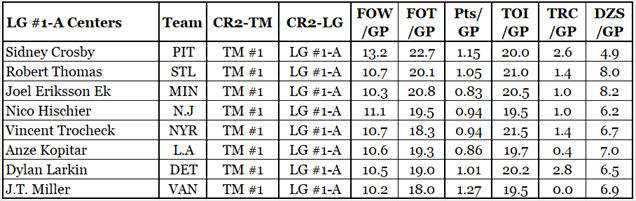
The top eight players win a lot of faceoffs, take a lot of faceoffs, score a lot, play a lot, are good with the puck and play in all situations (Crosby might be an exception). Let’s compare them to the LG #1-C group.
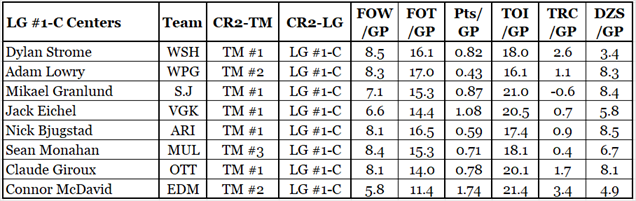
As compared to the LG #1-A group, this group wins and takes fewer faceoffs, they generally score less (McDavid is an exception), and they generally play less. To those of you who may think that McDavid should not be the #2 anything on his team: don’t be silly. He’s the second-best center because he scores a ton. He was clearly the #1 player for Edmonton, but also clearly not their #1 center.
That there are centers who are in the top 32 in the league but are #2 on their teams shows that good centers are not distributed one per team throughout the league. The lowest league-ranked TM #1 center was Mason McTavish of Anaheim, who was an LG #2-C center.
The two tables above provide confidence that CR2 evaluates centers fairly and accurately, based on the aspects of what it means to be a center. Now we can turn our attention to Mr. Suzuki, starting with 2023-24.
Nick Suzuki in 2023-24
The top four centers for Montreal in 2023-24 are shown below. Montreal relied heavily on Suzuki and Evans when it came to faceoffs.
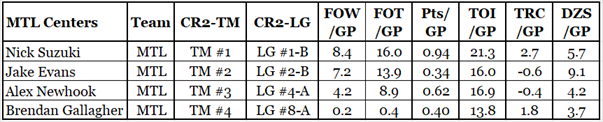
At the league level, Suzuki was an LG #1-B center, ranking 22nd in the league. A less charitable person might point out that 22nd place is towards the bottom of the LG #1-B group.
Nick Suzuki in 2024-25 The data used to evaluate centers in 2024-25 was copied in the middle of January 2025 (pre-vacation). The following table shows the LG #1-A centers.
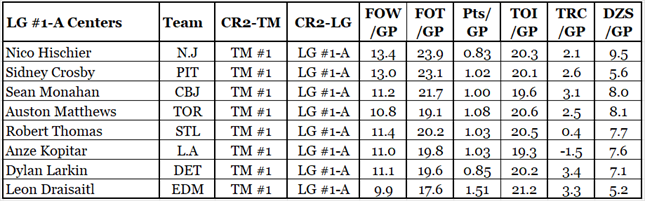
As the first commenter said, Suzuki is not an elite center, which means he’s not a LG #1-A. The following table shows Suzuki and his group mates, the LG #1-C centers.
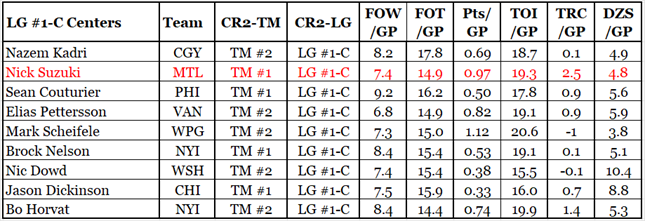
Suzuki’s league rating has slipped just a bit, from 22nd overall to 26th. He has dropped in faceoffs won and taken time-on-ice. He has been on the ice for fewer defensive zone faceoffs. Despite his decrease in defensive zone starts, his team-relative Corsi is down.
Allow me to give some credit to the first commenter: as he said, Suzuki is not an elite #1 center (LG #1-A) but he is a #1 center.
By the way, there are nine #1-C centers instead of eight because Dickinson and Horvat have the same CR2-Score.
Center Rating Two (CR2) System: Suzuki vs. Matthews
The second quoted commenter to the post that led to this article stated that he would take Suzuki over Matthews any time for a Stanley Cup run.
Fortunately for Toronto, they are no longer running the “Be a GM for a Day” contest that led to their trading Russ Courtnall to Montreal in return for alleged hockey player John Kordic. To be fair to the Toronto GM who made the trade, Gord Stellick, it is highly likely that he was forced to make that trade by Harold Ballard.
Let’s get back to the commenter’s statement. In what world would anybody consider that Nick Suzuki was more valuable than Auston Matthews, either as a Center or as a player?
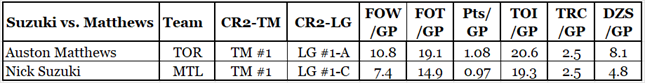
Let’s look at the CR2 data for Suzuki and Matthews, side by each.

Clearly, Suzuki is nowhere near as good a center. He wins fewer faceoffs, takes fewer faceoffs, gets fewer points, plays a little less and is used far less often for defensive zone faceoffs. They are tied at +2.5 for Team-Relative Corsi, but Toronto is a better team so it’s harder to be above the team level.
Also, in the last full season (2023-24) Suzuki was 27th in Productivity Rating while Matthews was 2nd. They are both good, but they are not close to equal.
Summary
The work on this article started in mid-January. I had hoped to finish it before a planned vacation, but that didn’t happen. We left for the Dominican Republic when the wind chill in Ottawa was below -20C, and when we got off the plane the temperature was +29C.
The one downside to the vacation is it was impossible to watch an NHL game. If that is not a “First World” problem, I don’t know what is!
Related Articles
Introduction to Productivity Rating
Technical Document: CR2 Center Rating System Calculations (planned article)